Download
1 / 21
210 likes | 320 Vues
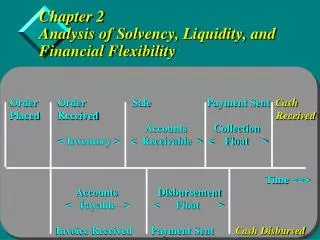
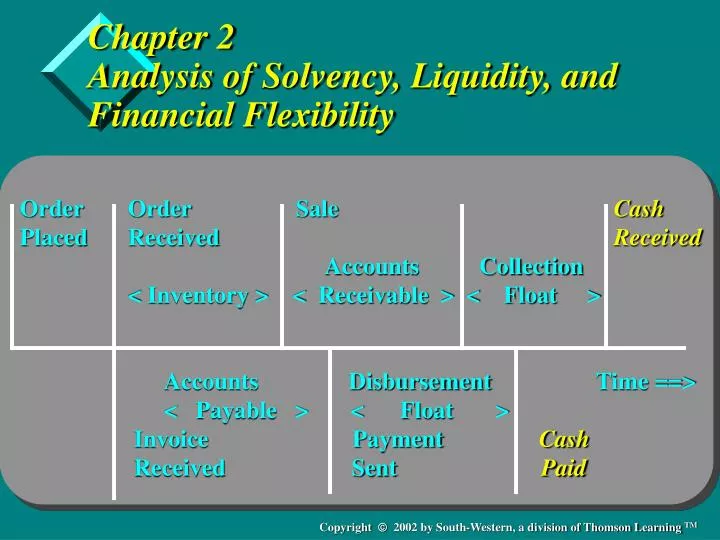
Chapter 2 Analysis of Solvency, Liquidity, and Financial Flexibility. Order Order Sale Cash Placed Received Received Accounts Collection

E N D
Chapter 2Analysis of Solvency, Liquidity, and Financial Flexibility • Order Order Sale Cash • Placed Received Received • Accounts Collection • < Inventory > < Receivable > < Float > • Accounts Disbursement Time ==> • < Payable > < Float > • Invoice Payment Cash • Received Sent Paid
Learning Objectives • Differentiate between solvency and liquidity ratios • Conduct a liquidity analysis • Assess a firm’s financial flexibility position
Financial Statements - Basic Source of Information • Balance Sheet • Income Statement • Statement of Cash Flows
Solvency Measures • Current Ratio • Quick Ratio • Net Working Capital • Net Liquid Balance • Working Capital Requirements
Current Ratio • Current assets • Current ratio = ------------------------- • Current liabilities • $6,339 • Current ratio = ----------- = 1.72 • $3,695 • 1995 1996 1997 1998 1999 • Current ratio 1.96 2.08 1.66 1.45 1.72
Quick Ratio • Current assets - Inventories • Quick ratio = ------------------------------------- • Current liabilities • $6,339 - $273 • Quick ratio = -------------------- = 1.64 • $3,695 • 1995 1996 1997 1998 1999 • Quick ratio 1.57 1.63 1.51 1.36 1.64
Net Working Capital Net working capital = CA - CL Net working capital = $6,339 - $3,695 = $2,644 ($ Millions) 1995 1996 1997 1998 1999 Net working capital $ 719 $1,018 $1,089 $1,215 $2,644
NWC and its Component Parts CA CL CA CL CA CL Cash Cash Cash A/P Mkt Sec A/P A/P Mkt Sec Mkt Sec A/R A/R N/P A/R N/P N/P Inventory Inventory Inventory CMLTD CMLTD CMLTD Prepaid Prepaid Prepaid Accruals Accruals Accruals NWC = CA - CL WCR = A/R + INV +Pre NLB = Cash + M/S - Accruals - A/P - N/P - CMLTD Net Working Capital Working Capital Requirements Net Liquid Balance
Working Capital Requirements • ($2,481+$273+$404) - ($2,397+$355+$943) • WCR/S = ----------------------------------------------------------- • $18,243 • ($537) • = ----------- = -0.029 • $18,243 • 1995 1996 1997 1998 1999 • WCR/S .055 .082 -.030 -.039 -.029
Net Liquid Balance • Net liquid balance = Cash + Equiv. - (N/P + CMLTD) • Net liquid balance = $3,181 - $0 • = $3,181 • ($ Millions) 1995 1996 1997 1998 1999 • Net liquid balance $527 $586 $1,325 $1,698 $3,181
What is Liquidity? • Ingredients • Time • Amount • Cost • Definition • Having enough financial resources to cover financial obligations in a timely manner with minimal costs
What is Liquidity - Examples • Amount and trend of internal cash flow • Aggregate available credit lines • Attractiveness of firm’s commercial paper and other financial instruments • Overall expertise of management
Liquidity Measures • Cash Flow From Operations • Cash Conversion Period • Current Liquidity Index • Lambda
Cash Flow From Operations ($ Millions) 1995 1996 1997 1998 1999 CFFO $243.4 $175.0 $1,362.0 $1,592.0 $2,436.0 Dell’s Cash Flow From Operations
Cash Conversion Chart Inventory Inventory Cash stocked sold received Days inventory held Days sales outstanding Days payables outstanding Cash conversion period Cash disbursed
Cash Conversion Period Calculations Cash conversion period = DIH + DSO - DPO (Days) 1995 1996 1997 1998 1999 DIH 40 37 15 9 7 DSO 57 50 42 44 50 ------- ------ ------ ------ ------ Operating cycle 97 87 57 53 57 DPO 60 41 63 63 62 ------- ------- ------- ------- ------- Cash conversion period 37 46 -6 -10 -5
How Much Liquidity is Enough? • Solvency - a stock or balance perspective • Liquidity - a flow perspective • Liquidity management involves finding the right balance of stocks and flows
Current Liquidity Index • Cash assets t-1 + CFFO t • CLI = --------------------------------- • N/P t-1 + CMLTD t-1 • $1,844 + $2,436 • CLI = -------------------- = 29.32 • $146 + $0 • 1996 1997 1998 1999 • CLI 1,755.62 33.47 85.00 29.32
Lambda • Initial liquid Total anticipated net cash flow • reserve + during the analysis horizon • Lambda = ------------------------------------------------------------------- • Uncertainty about the net cash flow during the • analysis horizon
Financial Flexibility • Sustainable Growth Rate Concept: • Uses = Sources • New Assets = New Equity + New Debt • gS(A/S) = m(S+gS)(1-d) + m(S+gS)(1-d)(D/E) • m(1-d)[1 + (D/E)] • g = ---------------------------------- • (A/S) - {m(1-d)[1 + (D/E)]} • .0765 x (1 - .00) x (1 + 2.3008) • g = ------------------------------------------------- = 270.49% • .3462 - [.0765 x (1 - .00)(1 + 2.3008)] • calculation uses 1998 data to calculate the sustainable 1999 g.
Summary • Chapter introduced basic concepts of: • solvency • liquidity • financial flexibility • Solvency: an accounting concept comparing assets to liabilities • Liquidity: related to a firm’s ability to pay for its current obligations in a timely fashion with minimal costs • Financial flexibility: related to a firm’s overall financial structure and if financial policies allow firm enough flexibility to take advantage of unforeseen opportunities.