Download

1 / 55
550 likes | 619 Vues
…… ?. Future of Public Health 1988. I Believe:. The Greatest Threat to Americans’ Health is How We Manage Our Wealth Supersizing and the Quality of American Life. Supersizing Advertising : Number of TV Ads Seen By Children. 40,000 per year. Average daily time spent using media:

E N D
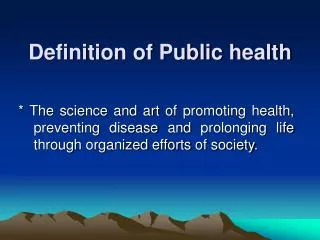
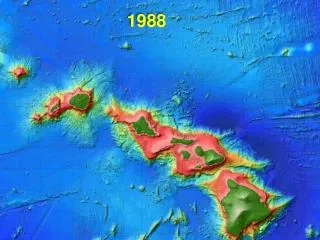
…… ? Future of Public Health 1988
I Believe: • The Greatest Threat to Americans’ Health is • How We Manage Our Wealth • Supersizing and the Quality of American Life
Supersizing Advertising :Number of TV Ads Seen By Children 40,000 per year Average daily time spent using media: 5 ½ HOURS Henry J. Kaiser Family Foundation. The Role of Media in Childhood Obesity, Issue Report, February 2004
Supersizing Soda Consumption -Wilkinson et al. Trends in Food and Nutrient Intakes by Children in the United States. Family Economics and Nutrition Review. 2002; 14(2):56-68.
ONE 20 oz SODA per day • 16 teaspoons of SUGAR • 250 calories • 8.75 hrs of moderate walking per week soda
Microsized Fitness of California’s Children Annual California Fitnessgram • Conducted in Grades 5, 7, and 9 • Measures 6 major fitness areas (e.g. aerobic capacity, body composition, flexibility) • 2004 Results: Who passed all standards? 25% Grade 5 29% Grade 7 26% Grade 9
Supersizing Land Consumption California Paves or Builds on over 400 acres every day
Supersizing Vehicle Travel Miles per Capita: 1960 to 1995 From 4000 to 9200 VMT per person
Credit: South Carolina Coastal Conservation League Credit: Constance E. Beaumant, NTHP Supersized Schools
Methylphenidate (Ritalin) Consumption,United States and Elsewhere: 1987 - 2001 Source: Science, Vol. 289, 4 August 2000, p. 721 and International Narcotics Control Board, 2002
Credit: Constance E. Beaumant, NTHP • “…students have better attendance, are less likely to drop out, exhibit fewer discipline problems, and perform better when attending a smaller high school.” Secretary of Education Richard Riley Oct 4, 2000
Current Sacramento “Foot Print” Supersized Communities http://www.sacregionblueprint.org
If Current Sacramento Development Trends Continue http://www.sacregionblueprint.org
19 million American adults • Leading cause of disability in the U.S. and worldwide Supersized Rates of Depression Source: National Institute of Mental Health (NIMH), 2001
Supersized Health Care Expenditures US Health Care Expenditures as Percent of GDP 1960 to Present $1.4 Trillion out of $10.08 Trillion GDP in 2001 www.cms.hhs.gov/statistics/nhe/
Microsized Investment in Public Health, Protection and Prevention Upstream Prevention -- Total < 3% Downstream Care and Management -------------------------------- Total 97%
Supersizing the number of days per monthAmericans Feel Unwell: Quality of Life Prevalence Data 14% increase Source: Centers for Disease Control and Prevention. Health-related quality of life: prevalence data. National Center for Chronic Disease Prevention and Health Promotion, 2003. Accessed March 21 at <http://apps.nccd.cdc.gov/HRQOL/>.
Obesity Trends* Among U.S. AdultsBRFSS, 1990 Source: Mokdad A H, et al. J Am Med Assoc1999;282:16, 2001;286:10.
Obesity Trends* Among U.S. AdultsBRFSS, 1993 Source: Mokdad A H, et al. J Am Med Assoc1999;282:16, 2001;286:10.
Obesity Trends* Among U.S. AdultsBRFSS, 1995 Source: Mokdad A H, et al. J Am Med Assoc1999;282:16, 2001;286:10.
Obesity Trends* Among U.S. AdultsBRFSS, 1999 Source: Mokdad A H, et al. J Am Med Assoc1999;282:16, 2001;286:10.
Obesity Trends* Among U.S. AdultsBRFSS, 2001 Source: Mokdad A H, et al. J Am Med Assoc1999;282:16, 2001;286:10.
Highest Number of Low-income Overweight Children (age 2-5) California’s Children Rank #2! Trust for America’s Health, Issue Report, October 2004
GI Surgery for Severe Obesity Risk and Complications: • 10-20% require follow-up surgery • Abdominal hernia • Break down of staple line • Gallstones • 30% develop nutritional deficiency Cost: $30,000 to $50,000 Source: NIDDK Highest Increase Rate of all Pediatric Surgeries
Surgery for Severe Obesity: US 1992 to 2003 NEJM March 11, 2004
Link Between Obesity and Type 2 Diabetes: Nurses Health Study AGE ADJUSTED RELATIVE RISK Colditz GA et al. Ann Intern Med. 1995;122:481-486.
No Data <4% 4%-6% 6%-8% 8%-10% >10% Diabetes and Gestational Diabetes Trends Among Adults in the U.S., BRFSS 1993-94 Mokdad AH, Ford ES, Bowman BA, et al. Prevalence of obesity, diabetes, and other obesity-related health risk factors, 2001. JAMA 2003 Jan 1;289(1).
No Data <4% 4%-6% 6%-8% 8%-10% >10% Diabetes and Gestational Diabetes Trends Among Adults in the U.S., BRFSS 1997-98 Mokdad AH, Ford ES, Bowman BA, et al. Prevalence of obesity, diabetes, and other obesity-related health risk factors, 2001. JAMA 2003 Jan 1;289(1).
No Data <4% 4%-6% 6%-8% 8%-10% >10% Diabetes and Gestational Diabetes Trends Among Adults in the U.S., BRFSS 1999 Mokdad AH, Ford ES, Bowman BA, et al. Prevalence of obesity, diabetes, and other obesity-related health risk factors, 2001. JAMA 2003 Jan 1;289(1).
No Data <4% 4%-6% 6%-8% 8%-10% >10% Diabetes and Gestational Diabetes Trends Among Adults in the U.S., BRFSS 2001 Mokdad AH, Ford ES, Bowman BA, et al. Prevalence of obesity, diabetes, and other obesity-related health risk factors, 2001. JAMA 2003 Jan 1;289(1).
Diabetes Projected Risks:For Babies Born in 2000 Girls: 38% lifetime risk • If diabetic before age 40, Lifespan shortened by 14 years (Quality of life by 19 years) Boys: 33% lifetime risk If diabetic before age 40, Lifespan shortened by 12 years. (Quality of life by 22 years) V Narayan et al: JAMA 8 Oct 2003
“Fit vs. Fat” Nurse Study 1976-2000 New England Journal of Medicine, Vol. 351, Dec. 23, 2004
Cost of Overweight, Obesity & Physical Inactivity California, 2000 Billions Health Care $10.172 Lost Productivity $11.168 Workers Comp. $ .338 Total $21.678 Projected Cost for 2005: $28 BILLION Source: CDHS, Unpublished report, 2004
Benefits of Physical Activity • Increases life span by 2 years • Reduces risk of CVD by 40% • Prevents/manages high BP, Diabetes • Decreases risk of breast & colon cancers • Improves mood and mental health • Contributes to weight control • Health care costs for active adults are $300-$400 less per year Surgeon General’s Report, 1996
Percentage of Trips in Urban Areas Made by Walking and Bicycling: North America and Europe 1995
10,000 stepsa day • 3234 people with IGT (Pre-Diabetes) • walked or exercised five times a week for 30 minutes • lost 5% to 7% of their body weight • reduced their risk of diabetes by 58%
Benefits of 10,000 steps Diabetes Prevention Program Study, 2003
Urban Sprawl, Physical Activity, Obesity, and Morbidity “Those living in Sprawling counties were likely to walk less (p=.004), weigh more (p<.001), and have a greater prevalence of hypertension (p=.018) than those living in compact counties.” (average six pound difference) Ewing R et al: American Journal of Health Promotion 18 (1) Sept/Oct 2003
Healthy Kids MakeBetter Students.Better Students MakeHealthy Communities.
“Safe Routes to School” • California Has Been a Leader • Los Angeles has been a leader in Siting schools back closer to where children live
Exercise Improved opportunities for walking and jogging Boyle Heights, California East Los Angeles www.preventioninstitute.org ENV1001_BE_11 Profiles_0704
Improved opportunities for walking and jogging Boyle Heights, California • Small, densely populated, predominantly Latino urban community • Evergreen Cemetery is one of the area’s main green spaces • Traffic-related deaths and hospitalizations in Boyle Heights far exceed CA rates www.preventioninstitute.org ENV1001_BE_11 Profiles_0704
CDC now mandates its new Buildings have attractive, daylit stairways at main entrance. • Elevators require more effort to get to than stairs
Community Action Grants Target funding and support to collaborative initiatives that examine communities and develop an action plan to increase healthy eating and physical activity. Multi-level Approach
School Gardens A fun and active approach to nutrition and agriculture –and a move to Quality