Download
1 / 16
160 likes | 282 Vues
Forest damage in a changing climate. Anna Maria Jönsson and Lars Bärring Dept. of Physical Geography and Ecosystem Analysis Geobiosphere Science Centre. Ongoing activities within ENSEMBLES. Modelling the risk f or frost damage to Norway spruce (RT 6.2)

E N D
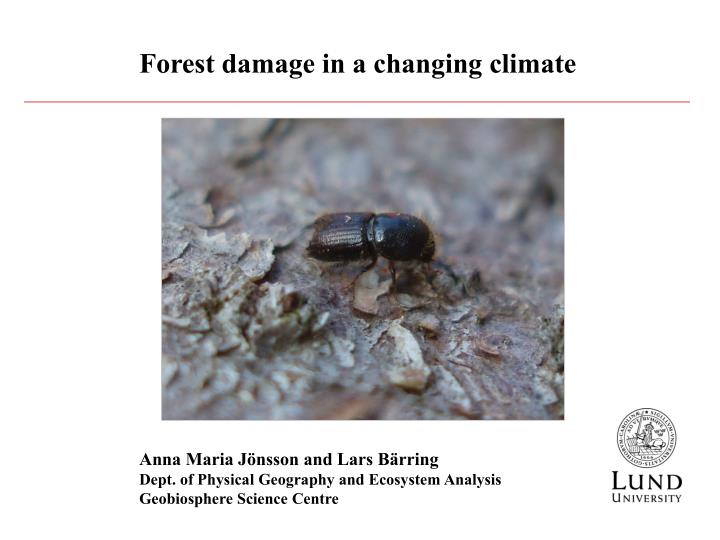
Forest damage in a changing climate Anna Maria Jönsson and Lars Bärring Dept. of Physical Geography and Ecosystem Analysis Geobiosphere Science Centre
Ongoing activities within ENSEMBLES • Modelling the risk for frost damage to Norway spruce (RT 6.2) • Rammig A., Jönsson A.M., Hickler, T., Smith B., Bärring L., Sykes M.T.(in prep.) Simulating acclimatization of Norway spruce: Linking a cold hardiness model to an ecosystem model. • Rammig, A., Jönsson, A.M.,Smith, B., Bärring, L., Sykes, M. (2007) Simulating the impact of extreme climatic events in ecosystem models. Marie Curie iLeaps-Workshop “Towards a process-based description of trace gas emissions in land surface models”, Helsingborg. • Rammig, A., Jönsson, A.M.,Smith, B., Bärring, L., Sykes, M. (2007) Impact of climate change on frost hardiness of Norway spruce – A predisposing factor for susceptibility to other stressors? Proceedings of the German Ecological Society 37, Marburg. • Rammig, A., Jönsson, A.M., Smith, B., Bärring, L., Sykes, M. (2006). Projecting ecosystem response to climate extremes. Proceedings of the German Ecological Society, Bremen 36, p.16.
Ongoing activities within ENSEMBLES • Modelling of the spruce bark beetle Ips typographus (RT 6.2) • Jönsson, A.M., Appelberg, G. , Harding, S.,and Bärring, L. (in prep.) The impact of climate change on the temperature dependent swarming and development of the spruce bark beetle, Ips typographus, in Sweden • Oral presentation:Jönsson, A.M., ”Granbarkborren – en scenarioanalys för 2008-2009, Klimatförändringens inverkan på svärmning och utveckling.” at the conference ”Skogen, barkborrarna och framtiden, Swedish forest agency, Jönköping, September 6, 2007. • Jönsson, A.M., Harding, S.,Bärring., L and Ravn, H.P. 2007:Impact of climate change on the population dynamics of Ips typographus in southern Sweden. Agricultural and Forest Meteorology 146:70-81. • Evaluation of RCM impact on impact model projections(RT 2b) • Jönsson, A.M. et al.(in prep). Warming up for spring frost damage in Europe.
Modelling the risk for frost damage to Norway spruce • Incorporated a cold hardiness model * • in the Ecosystem model LPJ-GUESS • Calculated the impact of frost damage on forest productivity * Jönsson, A.M., Linderson, M.-L., Stjernquist, I., Schlyter, P. and Bärring, L. 2004: Climate change and the effect of temperature backlashes causing frost damage in Picea abies. Global and Planetary Change 44:195-207.
Simulated average stem wood volume using RCA3-ECHAM4 A2-scenario data 300 250 200 m3 / ha 150 North Sweden Central Sweden South Sweden 100 50 Modelled without frost damage Modelled with frost damage 0 1976-2005 1981-2010 2011-2040 2041-2070 2071-2100
Percentage of increase relative to 1976-2005 Reduction attributed to frost damage 50 North Sweden Central Sweden South Sweden 40 30 20 Modelled without frost damage Modelled with frost damage Reduction attributed to frost damage % 10 0 Simulated with RCA3-ECHAM4 A2-scenario data -10 -20 -30 2071-2100 1976-2005 1981-2010 2011-2040 2041-2070
Egg development Summer swarming? > Egg development Spring swarming Winter hibernation high mortality for not completely developed bark beetles Modelling the annual cycle of spruce bark beetle Jönsson, A.M., Harding, S.,Bärring., L and Ravn, H.P. 2007:Impact of climate change on the population dynamics of Ips typographus in southern Sweden. Agricultural and Forest Meteorology 146:70-81.
Impact of climate change on spruce bark beetle 2071-2100 minus 1961-1990 * modelled with RCA3-ECHAM4 A2 and B2, RCA3-ECHAM5 A1b
-August -July -June Modelled extension of a second generation* 2041-2070 2071-2100 1961-1990 1981-2010 2011-2040 Percent of years with two generations: 1-3% 2-10% 8-18% 30-49% 63-81% * RCA3-ECHAM4 A2
RCM impact on biological impact assessments Increased awareness of climate change has created need for using climate model data in combination with biological models for assessing the potential impact of climate change. Assessments of biological impacts of future climate change depend on the representativity and quality of regional climate model (RCM) data. Climate model data deviate from observed climate due to properties of gridded data, model biases and uncertainties from a range of sources. The weather impact on biological systems is often complex, involving cumulative effects and thresholds. This increases the risk for amplification of otherwise modest systematic errors.
Spring backlash index * – an example of a biological impact model * Jönsson, A.M., Linderson, M.-L., Stjernquist, I., Schlyter, P. and Bärring, L. 2004: Climate change and the effect of temperature backlashes causing frost damage in Picea abies. Global and Planetary Change 44:195-207.
Spring backlash index The maps show changes in severity of spring frost damage between future scenario A2 (year 2071-2100) and the common period (1961-1990). The spring backlash index was calculated with data from regional climate models in the PRUDENCE data-set. All RCMs were forced by lateral boundary conditions from the HadAM3H global model.
Conclusions of RCM impact on impact model projections • Assessments of climate change impact on biological systems can be highlysensitive to the choice of regional climate model. • It is often not possible to account for RCM biases simply by calculating a climate change signal: • Timing and response magnitude arecommonly based on sharp thresholds and non-linear relationships, respectively. • Calculations of processes dependent on accumulated weather impact may be highly sensitive to accumulation of climate data biases. • The more complex models, the higher the risk for systematic errors caused by carry-over effects.
Work within ENSEMBLES • RCM-downscaled ERA40 data will be used to calibrate for systematic errors and we will explore statistical downscaling methods for reaching site-specific spatial resolution. Focus will be on in biological impact assessments at different time-scales, using two impact models: • Time-scales Impact models • Short-term calculations (daily values) • Response magnitude • Above or below thresholds • Combination of weather impact • (precipitation & temperature etc) • Seasonal effects • Accumulation of weather impact • response magnitude • timing of fulfilled requirements • Carry-over effects • Timing and occurrence of subsequent steps Frost damage Spruce bark beetle
Temperature sums and thresholds affecting spruce bark beetle Egg development Temperature sum 625-750 d.d.(+5oC) Summer swarming if Tmax >20oC and Tmean has not fallen below 15oC for the first time during autumn > Egg development Temperature sum 625-750 d.d.(+5oC) Spring swarming Tmax >20oC Recover from hibernation Temperature sum>120 d.d.(+5oC) Winter hibernation high mortality at low temperatures for not completely developed bark beetles Two generations of bark beetles Response Temperature increase
Temperature sums and thresholds affecting tree phenology Changes in risk for frost damage Growth period Temperature sum Response Budburst Temperature sum spruce 120-220 d.d.(+5oC) Light and chilling requirements > Temperature increase Cold hardening Light, Tmean, Tmin Chilling Temperature sum Tmean >-3.4oC, <10.4oC Onset of photosynthesis and dehardening Tmean > +5oC, 4 consecutive days Cold hardiness level affected by ambient temperature Frost damage: any time when Tmin< cold hardiness