Download
1 / 40
500 likes | 779 Vues
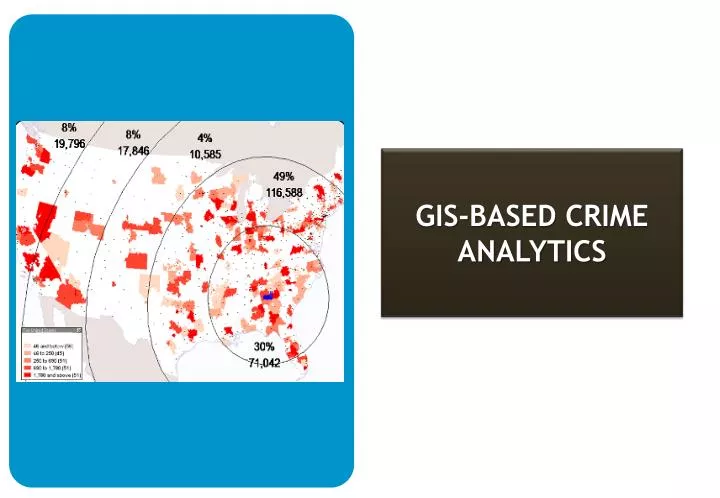
GIS-BASED CRIME ANALYTICS. CCTNS I – Setting the Baseline. CCTNS spans across 28 States and 7 UT's covering all 15,000+ Police Stations and 6,000+ Higher Police Offices.

E N D
CCTNS I – Setting the Baseline CCTNS spans across 28 States and 7 UT's covering all 15,000+ Police Stations and 6,000+ Higher Police Offices Includes Horizontal connectivity of Police units (linking police units at various levels within the States – Police Stations, District Police Offices, State Headquarters, SCRB and States, through State Headquarters and SCRB, to NCRB at GOI level) Vertical connectivity, linking Police functions at State and Central level to external entities. Automation of Policing process and generation of nationwide digital database via customized CAS Citizen’s interface to provide basic services to citizens
CCTNS I – The Data Provider CAS Centre ` SDC FIR Registration
Emergency Response System- The Data provider Help Arrived GRPS TOWER CALLTAKER DISPATCHER Event GRPS SERVICE PROVIDERDATA CENTER PRI Line from Exchange to Police Control Room Police Control Room Wireless Communication with Field Officers DIAL 100 DESTRESS CALLER MTNL / BSNL EXCHANGE PCR VAN WITH MDT VECTOR MAP DispatchedNearest Patrol Vehicle SATELLITE IMAGERY
CCTNS II – Advanced Solutions • GIS Based Crime Analytics • Computer Aided Dispatch & Traffic Management System • Mobile Data Terminals • Biometrics • Automated Fingerprint Identification System, • Automated Facial Recognition System, • Fingerprint Enrollment Devices
Why 'Geo-Crime Analysis' ? • Large volume of crime data available and being digitized • CCTNS Phase I • Existing Computer aided Dispatch/ PCR System • Current system • Provides tabular reports • Current Report not Geospatial enabled • Location based decision support is impossible • Planning & Resource allocation is a nightmare • Visualization of geo-enabled crime data is need of the hour 'Geo-Crime Analysis' is the solution for the future
Building blocks of 'Geo-Crime Analysis' Spatial distribution of incidents Incident Analysis Hotspot Analysis Predictive Analysis Cluster, Buffer & Proximity Analysis Facilitate seamless information exchange for visualization, dissemination and analysis. Resource Planning Demand Analysis Patrolling Activities Preventive Measures
Stakeholders in the 'Geo-Crime Analysis' Devp Project MHA NCRB POLICE MODERNIZATION BORDER MANAGEMENT DISASTER MANAGEMENT INTELLIGENCE AGENCIES RAW NTRO DIRECTORATE REVENUE INTEL DEFENCE INTEL JOINT CIPHER BUREAU DIRECTORATE INCOME TAX IB STATE POLICE DEPT. ENFORCEMENT ECONOMIC OFFENCES WING CRIME BRANCH PROTECTION & SECURITY RIOT CONTROL POLICE QUICK RESPONSE TEAM TRAFFIC STATE POLICE WIRELESS ATS MISSING PERSONS BUREAU ANTI-EXTORTION ANITI-NARCOTICS JUVEINILE AID PROTECTION SPECIAL POLICE
Scope of Work To establish Unified and Secured Geospatial Environment (USGE) based on spatial data collected from multiple sources such as Survey of India, Urban authorities, National Informatics Center and other sources and integration with Crime Data from CCTNS Phase I and data gathered from CADS Development, testing, initial rollout and certification of 'Geo-Crime Analysis' Implementation of a National and State level GIS based crime analytics hub Customization and configuration of 'Geo-Crime Analysis' Capacity building and training activities Operations and maintenance services for a period of five years from the date of nation-wide “Go live” of 'Geo-Crime Analysis'
'Geo-Crime Analysis' Broad Level Architecture External Agencies Central NCRB Passport Healthcare Analyst Work Space Server Farms Police CAD BI Dashboard GIS Analyst IVFRT 'Geo-Crime Analysis' Application Web Database Authentication Object Search Engine Web Services Social Network Transport Extract, Transform and Load (ETL) RGI Telecom SP State NCRB E-Courts Finance Analyst Work Space Server Farms GIS Data Updation GIS Desktop GIS Analyst Image Database GIS Desktop MIS RDBMS Existing – CCTNS I Document Repository Existing Triple Store GIS RDBMS GIS Data Providers Unified and Secured Geospatial Environment (USGE) SOI Configuration Services Forest Dept. Catalogue Security & Authentication GIS Data Collation Alerts Config Security Config NRSA Data Modelling Monitoring & Auditing Data Mapping Monitor & Audit Config NCRB
GIS Data Management • NCRB will provide base map with additional vectors layers (map) relevant to the Police department for • Streets • Police station and beat boundaries • District boundaries • State boundaries and • International boundaries etc. Integration of these maps with the 'Geo-Crime Analysis' application
'Geo-Crime Analysis' - Basic GIS functionalities required Measure Distance Tool Searches Measure XY values Pin Mapping Basic GIS Measure Area Tool Thematic Mapping Routing Buffer Analysis Drawing features Temporal Analysis Search for a Crime Markup Tools
Temporal Analysis – Day of the Week Complaints of Playing Cricket
Query Command and Pin Mapping Colour Coded Events
'Geo-Crime Analysis' - Advanced GIS Suspect Analysis Incident Analysis Advanced GIS Proximity Analysis Hotspot Analysis Interface with proposed CADS & AVL Variation over Time Analysis Journey to Incident Predictive Analysis
Incident Analysis Crime counts per region
Definition: Extract areas where the concentration of incidents is high Identify clusters in geographic space Options: Simple one click generation Advanced modes – assign weights, choose normalization Benefits: Distills complex information into a simple picture Effective communication products for public education Helps direct assets where they are most needed Hot Spot Mapping Public Disturbance 2004 Domestic Dispute 2004 Public Disturbance 2004
Semantic Analysis Same word, different meanings • The normal search engine doesn't know what the words mean. It treats searches for "potato chips" and "airline tickets" in the same way -- by looking for pages that match those patterns of letters. • Semantic search seeks to improve search accuracy by understanding searcher’s intent and the contextual meaning of terms as they appear in the searchable dataspace, whether on the Web or within a closed system, to generate more relevant results. • "Jane Smith, mother of Janet Brown," it can deduce that Janet Brown is the daughter of Jane Smith finest Different words, same meaning jubliant Best joyous highest highest glad merry happy leading outstanding top content overjoyed ecstatic supreme
Semantic Analysis…..contd • Based on a language-specific network of idioms it: • Extracts entities • Extracts inter-entity links • Concepts • Events / facts • Categorizes into customer specific subjects/categories, or into human general categories • Summarizes the text
Benefits of 'Geo-Crime Analysis' Insights through analysis of data from disparate data sources All existing crime data gets geocoded GIS based location context for effective analysis & visualization Enable multiple analytical scenarios – Hotspot, Predictive, Change over time, Incident, Suspect Analysis etc. Provides seamless collaboration capability with multiple agencies Enhance Crime & Criminal tracking functions improve efficiency and effectiveness of policing