Download
1 / 31
310 likes | 423 Vues
Simulation and Analysis of Entrance to Dahlgren Naval Base. Jennifer Burke. MSIM 752 Final Project December 7, 2007. Background. Model the workforce entering the base Force Protection Status Security Needs Possibility of Re-Opening Alternate Gate 6am – 9am ~5000 employees 80% Virginia

E N D
Simulation and Analysisof Entrance to DahlgrenNaval Base Jennifer Burke MSIM 752 Final Project December 7, 2007
Background • Model the workforce entering the base • Force Protection Status Security Needs • Possibility of Re-Opening Alternate Gate • 6am – 9am • ~5000 employees • 80% Virginia • 20% Maryland • Arena 10.0
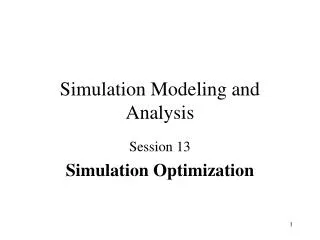
Gate C Map of Gates Gate B Gate A
Probability Distributions • Employee arrival process • Rates vary over time • How many people in each vehicle? • Which side of base do they work on? • Which gate will they enter?
Modeling Employee Arrival Rates • First choice • Exponential distribution with user-defined mean • Change it every 30 minutes • Wrong! • Good if rate change between periods is small • Bad if rate change between periods is large
Modeling Employee Arrival Rates • Nonstationary Poisson Process (NSPP) • Events occur one at a time • Independent occurrences • Expected rate over [t1, t2] • Piecewise-constant rate function
NSPP using Thinning Method • Exponential distribution • Generation Rate Lambda >= Maximum Rate Lambda • Accepts/Rejects entities • 30 min period when entity created • Expected arrival rate for that period • Probability of Accepting Generated Entity Expected Arrival Rate Generation Rate
Carpooling • Discrete function • Virginia • 60% - 1 person • 25% - 2 people • 10% - 4 people • 5% - 6 people • Maryland • 75% - 1 person • 15% - 2 people • 5% - 4 people • 5% - 6 people ~3000 vehicles
Gate C Side of Base Far Side = 30% Gate B Near Side = 70% Gate A
Gate C Gate Choice Far Side = 30% Gate B Near Side = 70% Gate A
Gate Delay • Gate Delay = MIN(GAMMA(PeopleInVehicle * BadgeTime/Alpha,Alpha),MaxDelay) _______________________________________ • GAMMA (Beta, Alpha) • α = 2 • μ = αβ = α(PeopleInVehicle * BadgeTime) • β = (PeopleInVehicle * BadgeTime) α • MaxDelay = 360 seconds or 6 minutes
Batching Results • Temporal-based batching • 5 minutes per batch • 2 significant time periods (due to queues emptying during 0630-0700 time frame) • 0600-0700 • Removed initial 10 minutes (before queue becomes significant) • 0700-0900 • Removed initial 5 minutes (before queue becomes significant)
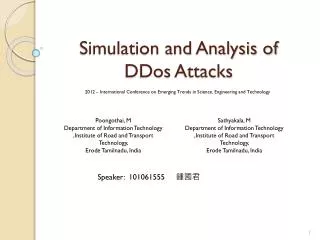
Added Gate – Gates A, B, & C Baseline – Gates A & B Added Security – Gates A, B, & C Added Security – Gates A & B
Results • Baseline model • Avg # vehicles entering base = 3065 • 0600-0900 Maximums • Max vehicles in queue • Gate A = 5 • Gate B (right lane) = 3 • Gate B (left lane) = 5 • Max wait time (seconds) • Gate A = 5.481 • Gate B (right lane) = 5.349 • Gate B (left lane) = 4.726
Results (cont.) • Added security model • Avg # of vehicles entering base = 3034 • 0600-0900 Maximums • Max vehicles in queue • Gate A = 86 • Gate B (right lane) = 27 • Gate B (left lane) = 50 • Max wait time (seconds) • Gate A = 243.33 • Gate B (right lane) = 242.66 • Gate B (left lane) = 242.19
Results (cont.) • Added gate model • Avg # vehicles entering base = 3065 • 0600-0900 Maximums • Max vehicles in queue • Gate A = 5 • Gate B (right lane) = 3 • Gate B (left lane) = 4 • Gate C = 3 • Max wait time (seconds) • Gate A = 5.481 • Gate B (right lane) = 5.349 • Gate B (left lane) = 4.726 • Gate C = 4.605
Results (cont.) • Added gate, added security model • Avg # of vehicles entering base = 3034 • 0600-0900 Maximums • Max vehicles in queue • Gate A = 86 • Gate B (right lane) = 27 • Gate B (left lane) = 36 • Gate C = 18 • Max wait time (seconds) • Gate A = 243.33 • Gate B (right lane) = 242.66 • Gate B (left lane) = 242.63 • Gate C = 242.19
Running Tests • 50 Replications • Compared • Wait times at the gates • Number of cars in line at the gates • Hypothesis testing • 95% confidence interval • Single tail test, talpha • talpha = (1.671 + 1.684)/2 = 1.6775
Hypothesis of Wait Times (seconds) • H0: μgate A,baseline = 1 • Ha: μgate A,baseline < 1 • H0: (μgate A,added security – μgate A,baseline) = 0 • Ha: (μgate A,added security – μgate A,baseline) > 0 • H0: (μgate B,added security, added gate – μgate B,added security) = 0 • Ha: (μgate B,added security, added gate – μgate B,added security) < 0 • H0: (μgate C,added security, added gate – μgate C,added gate) = 0 • Ha: (μgate C,added security, added gate – μgate C,added gate) > 0
– X – Z = X – μ σ / n ^ σ ^ Example CalculationAnalysis of Wait Times • Gate A – Baseline model • = 0.004572 seconds • = 0.008355 seconds Z = 0.004572 – 1 0.008355/7.071 -zα< Z to Reject H0 Z = - 842.4479 - 842.45< -0.16775 Z = -842.4479 Reject H0
Hypothesis of Vehicles in Line • H0: μgate A,baseline = 1 • Ha: μgate A,baseline < 1 • H0: (μgate A,added security – μgate A,baseline) = 0 • Ha: (μgate A,added security – μgate A,baseline) > 0 • H0: (μgate B,added security, added gate – μgate B,added security) = 0 • Ha: (μgate B,added security, added gate – μgate B,added security) < 0 • H0: (μgate C,added security, added gate – μgate C,added gate) = 0 • Ha: (μgate C,added security, added gate – μgate C,added gate) > 0
– d – T = d – D0 σd / n Example CalculationAnalysis of Vehicles in Line • Added security model – Gate A compared to baseline mode – Gate A • = μ1 – μ2 = 12.185 vehicles • = 23.27 vehicles σd tα< T to Reject H0 T = 3.7025 3.7025> 1.6775 T = 12.185 – 0 23.27/7.071 T = 3.7025 Reject H0
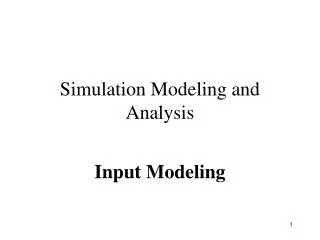
Gate B w/Security & Added Gate Compared to Gate B w/Security
Lessons Learned • Like to get exact census data • Hypothesis testing for a defined increase in wait time or vehicles in line • H0: μwait, w/ security – μwait, w/o security = N • Thinning method is very helpful • Possible improvements would include traffic patterns to control gate entry • Gate C Unavailable to South-bound traffic • Comparison of Dahlgren Base entry to other government installations