Download
1 / 6
60 likes | 150 Vues
1. Both procedures have advantages: Mehlich: higher correlation Bray: visible differences in response Both require more data. 2. Stat. Method Anal. Method Model R 2 CL ________________________________________________________________________________________________

E N D
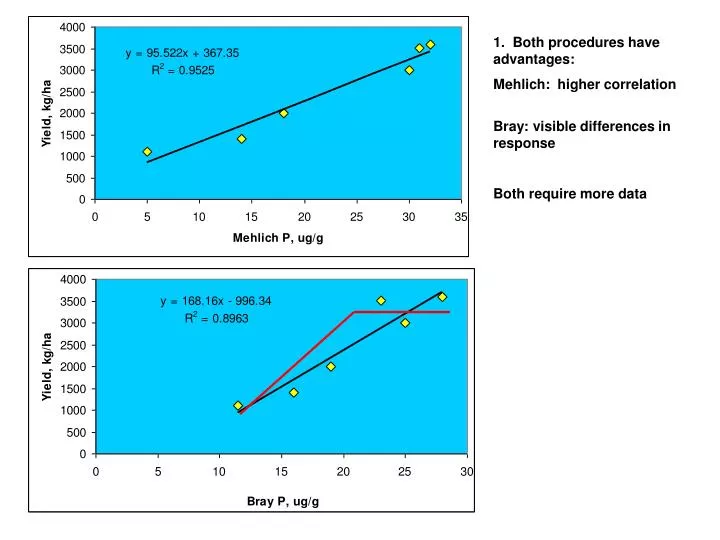
1. Both procedures have advantages: Mehlich: higher correlation Bray: visible differences in response Both require more data
2. Stat. Method Anal. Method Model R2 CL ________________________________________________________________________________________________ Quadratic Bray & Kurtz ___________________________ -970 ____ Linear-Plateau Bray & Kurtz ___________________________ 30 ____ Square Root Bray & Kurtz ___________________________ 1.69 ____ Cate Nelson Bray & Kurtz ___________________________ 23 ____ Quadratic Mehlich III ___________________________ -1.06 ____ Linear-Plateau Mehlich III ___________________________ 34 ____ Cate-Nelson Mehlich III ___________________________ 30 ____ Square Root Mehlich III ___________________________ 5.79 ____ ________________________________________________________________________________________________ CL - critical soil test level
Need more farmer data • Repeat step 1 until the ideal procedure was identified
Stat. Method Farmer Model R2 FR EFR ________________________________________________________________________________________________ Quadratic 1 ___________________________________ 166 144 ____ Linear Plateau 1 ___________________________________ 100 ____ ____ Square Root 1 ___________________________________ 1244 275 ____ Cate-Nelson 1 ___________________________________ 115 ____ ____ Quadratic 2 ___________________________________ 145 124 ____ Linear Plateau 2 ___________________________________ 50 ____ ____ Square Root 2 ___________________________________ 208 110 ____ Cate-Nelson 2 ___________________________________ 50 ____ ____ Quadratic 3 ___________________________________ 139 106 ____ Linear Plateau 3 ___________________________________ 54 ____ ____ Square Root 3 ___________________________________ 205 74 ____ Cate-Nelson 3 ___________________________________ 75 ____ ____ Quadratic 4 ___________________________________ 138 51 ____ Linear Plateau 4 ___________________________________ 47 ____ ____ Square Root 4 ___________________________________ 170 29 ____ Cate-Nelson 4 ___________________________________ 75 ____ ____ Mitscherlich 1 ___________________________________ 398 146 ____ Mitscherlich 2 ___________________________________ 205 90 ____ Mitscherlich 3 ___________________________________ 202 75 ____ Mitscherlich 4 ___________________________________ 138 40 ____ ________________________________________________________________________________________________ FR - recommended fertilization rate EFR - recommended economic fertilization rate
4. P recommendation Table Mehlich 3 % Sufficiency Fert. Rec. 0-5 10 100 5-15 25 80 15-20 35 60 20-30 65 40 >30 100 0
All sites showed some response to applied P. The need for a site with higher soil test P was evident in this example