Download
1 / 26
260 likes | 335 Vues
Assessing Market Barriers to Distributed Generation. Backup Rates and other Misleading Questions Thomas R. Casten Chairman World Alliance For Decentralized Energy 630-371-0505, tcasten@privatepower.net March 28, 2003. Presentation Outline.

E N D
Assessing Market Barriers to Distributed Generation Backup Rates and other Misleading Questions Thomas R. Casten Chairman World Alliance For Decentralized Energy 630-371-0505, tcasten@privatepower.net March 28, 2003
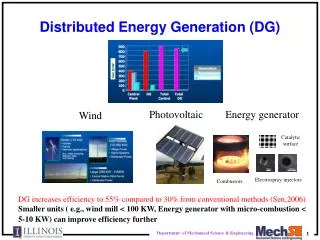
Presentation Outline • The essential question – What is optimal way to provide expected electrical load growth? • Describe expected results of meeting load growth with100% new GG, 100% new DG, and various mixtures of CG and DG • Meeting all load growth with DG reduces capital expenditures, power costs, emissions, CO2 and vulnerability • Explore why power markets don’t optimize • Explore locational benefits and costs, how new rules could reward incumbent utilities for encouraging optimal path of DG?
What are “Correct” Standby rates is a misleading question • Question assumes DG has a net cost to society • Assumes no load growth, or no cost to meet expected load growth with new central generation • Assumes transmission is adequate for load growth, • Assumes central generation is efficient and clean • Assumes CG and transmission is cheaper than DG • Assumes what is good for DISCO’s is good for society, or stated another way, • Assumes regulatory rules reward DISCO behavior that is beneficial to society
Each Assumption is False • DOE projected 20 year load growth: • US = 44% • New England 28% • US transmission is badly congested • Likely mix of new DG is more fossil efficient and less polluting than likely mix of new CG
Is DISCO and Society Benefit the Same?Perspective on Govt. Rules • “A history of American government limited to those laws which sprang pure from the brains of the nation’s politicians with no special interests as their objects would be a very short history indeed.” Jonathan R. T. Hughes, The Government Habit, Basic Books Inc., 1977 • Incumbents vastly better financed to promote protective rules than insurgent companies blocked by current rules • Regulation always flawed, filled with unintended consequences
Perspective on Electric Regulation • Ninety year history, sub-optimal regulations reward capital investment, create throughput bias, ignore or penalize efficiency gains and block DG worldwide • Utility efficiency stagnant at 33% for 42 years and counting • Looming problems of CO2 and criteria pollution, fossil fuel dependency, balance of payments, and vulnerability all exacerbated by bad regulation that promotes CG
What are Societies Goals for the Heat & Power System? • Consensus goals are to minimize: • Capital expenditures • Cost per kWh to users • Criteria pollutant emissions • Fossil derived CO2 emissions • Vulnerability to storms and terrorists • Power failures
The Process • We modeled each generation technology – capital cost, performance, emissions • We checked impact on each of societies goals from meeting all load growth with new CG, with all new DG, and with various mixtures • We summed up all societal benefits and costs for each approach to satisfying load growth
Inputs included: • Baseline data for existing generation • Average line losses for CG power – 9% • Load factors for each technology • Line losses at peak load – 15% • Progress expected on cost and performance for each technology • DOE projected 44% load growth through 2020 • Nine mixtures of CG and DG
Results – Optimizing Generation of Incremental Heat and Power
Why Don’t Markets Move to Optimal Solutions? • Power is not a free market • Optimization requires on-site generation to utilize waste heat • 90 year old laws and regulations are barriers to efficiency • DISCO’s are rewarded for capital investment, penalized for loss of throughput, given no rewards for improving efficiency or cutting costs to consumers
Observations on Locational Benefits/Costs of DG? • Net of costs and benefits dramatically favors using DG to meet future load growth • Need 13,000 MW of new generation every year for US, 282 MW every year for New England • If CG, must build 118% more generation and 118% of load growth in new T&D • Emissions and vulnerability concerns favor DG as well
What are True Standby Costs • Typical DG has 96% availability, i.e., 4% probability of outage. • 1000 DG units of 1 MW average capacity have actuarial need for 40 MW backup, if all were fully utilized at peak hour. • Utilities have been unable to invest in adequate T&D, congestion increasing • T&D is aging, book value is shrinking • DG saves new T&D and holds down costs of future power
Impact of Standby Charges • Any standby charge serves to discourage DG, and will thus raise future costs of electric power and pollution associated with that generation • Future generation will not be optimal unless locational value of generation is recognized and rewarded, i.e. a DG payment.
Other Rule Changes Needed • Reward DISCO’s for encouraging DG and avoiding more CG and more T&D • Allow wires utilities to invest in DG, providing they give equal treatment to third party DG • Increase DISCO allowed rates of return based on T&D avoided, line losses, and efficiency gains • Refuse to authorize T&D investment until DG opportunities have been exhausted
Conclusions • DG has significant net benefits in economics, emissions and vulnerability • DG should receive significant locational benefits for net value it provides to other users • Utilities are rewarded for blocking DG, even though more DG will dramatically benefit society • Any backup charges will make the future cost of heat and power higher
Thanks for Listening For more detail, go to www.privatepower.net or to www.localpower.org