Download
1 / 51
1.52k likes | 2.97k Vues
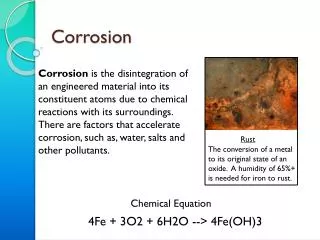
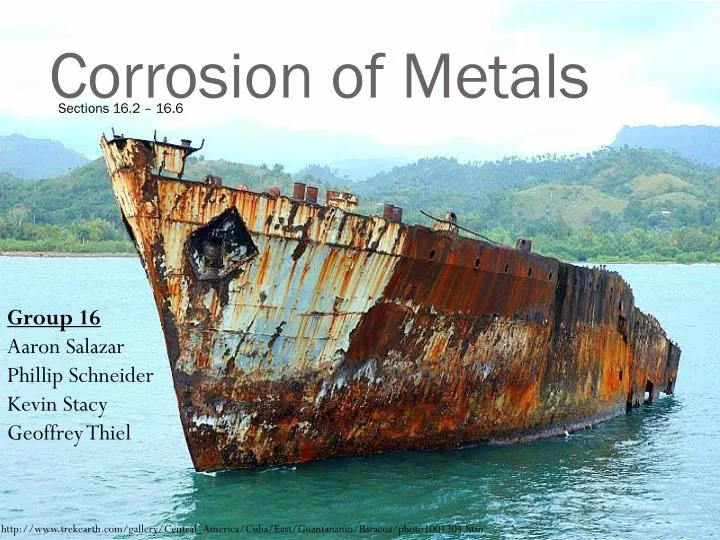
Corrosion of Metals. Sections 16.2 – 16.6. Group 16 Aaron Salazar Phillip Schneider Kevin Stacy Geoffrey Thiel. http://www.trekearth.com/gallery/Central_America/Cuba/East/Guantanamo/Baracoa/photo1001204.htm. Electrochemical Cell. Electrochemistry. Figure 1.

E N D
Corrosion of Metals Sections 16.2 – 16.6 Group 16 Aaron Salazar Phillip Schneider Kevin Stacy Geoffrey Thiel http://www.trekearth.com/gallery/Central_America/Cuba/East/Guantanamo/Baracoa/photo1001204.htm
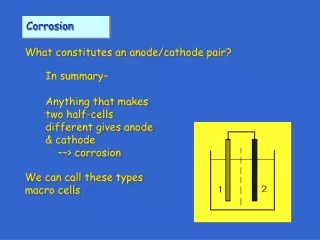
Electrochemical Cell Electrochemistry Figure 1 Iron corrodes while copper electrodeposits, and the potential (voltage) between the two cells is the measure of the electron transfer. For this system the Potential is .78V • For Metallic material the corrosion process is normally electrochemical and is due to the transfer of electrons from one species to another. • Oxidation - when Metal atoms characteristically lose or give up electrons • Reduction - when a metal takes the electrons that are being transferred, reducing its charge. • Overall Reaction (Figure2) is constructed of at least one oxidation and one reduction reaction and will be the sum of these two equations • The two separate reactions that are combined to make an overall reaction are the Half Reactions. • standard emf series (Figure 3)- a series generated by coupling the standard hydrogen electrode to standard half-cells for various metals, and then ranking them according to measured voltage. The difference between standard voltages • galvanic couple- a pair of substances (ex. two different metals) that when placed in a proper solution produces an electromotive force by chemical action. http://www.knovel.com/web/portal/basic_search/display?_EXT_KNOVEL_DISPLAY_bookid=656 Half Reactions and Overall Reaction Figure 2 Cu(s) Cu2+(aq) + 2e- 2 Ag1+(aq) + 2e- 2 Ag(s) 2 Ag1+(aq) + Cu(s) Cu2+(aq) + 2 Ag(s) Figure 3 Summary: 1 http://www.matsceng.ohio-state.edu/mse205/lectures/chapter18/chap18_slide5.gif
Potential and Spontaneity http://www.saskschools.ca/curr_content/chem30_05/6_redox/labs/electrochem_cells.htm • Potential is a measure of electron transfer • We use the potentials, V1 and V2, to calculate the change in • potential, ΔV, for a given system, an electrochemical cell • ΔV = V2 - V1 • The spontaneity of an electrochemical cell is determined by • the ΔV • Another way to calculate ΔV is using the Nernst Equation • Applying this equation to alloys we need the concentrations • of the metal in each alloy and the equation becomes • The temperature and concentration affect the cell potential • greatly • The galvanic series is more practical than the emf series • because it is not an idealized situation Oxidation Reduction ΔV < 0 not spontaneous ΔV > 0 spontaneous Shown are two examples of electrochemical cells displaying the oxidation and reduction processes along with the direction of electron flow, current flow, and the resulting voltage. Summary: 2 http://np-apchemistry.wikispaces.com/chapter19
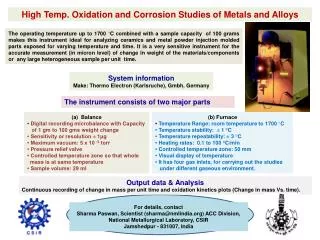
Corrosion Rates Importance: Corrosion rate, the rate of material removal as a consequence of chemical actions, is an important design parameter for engineers because corrosion can destroy process piping and damage equipment if not accounted for properly. We can calculate the corrosion rate as either: Corrosion Penetration Rate (CPR) - thickness loss over time Or as Rate in (mol/m2-s) Based on current density through material. Prediction of Corrosion Rates: It is important to be able to accurately predict corrosion rates in order to adequately protect equipment. The most common prediction method uses Polarization data. This is based on the overvoltage or displacement of an electrode’s potential from its equilibrium value. http://www.providenceri.com/publicworks/hurricane/activation_polarization.gif This figure shows the corrosion of steel over time. Based on current density through material. Summary: 3
Polarization Concentration Polarization is the polarization component that is caused by concentration changes in the environment adjacent to the surface. Activation Polarization refers to when the reaction rate is limited by the activation energy barrier is associated with the slowest, rate limiting step in the corrosion process. • Adsorption of H+ ions from the solution onto the metallic surface. • Electron transfer from metallic surface to form a hydrogen atom. • Combining of two hydrogen atoms to form hydrogen molecule • The coalescence of many hydrogen molecules to form a bubble. Depletion Zone H+ H+ Cathode H+ H+ *Team generated graphic. H+ This figure illustrates the presence of a depletion zone near the surface of a metal cathode. Depletion zones can form when reaction rate is high or solution concentration is low. This system is said to be concentration polarized. http://www.providenceri.com/publicworks/hurricane/activation_polarization.gif H+ H+ Polarization data may be plotted according to: Intersection The intersection of the extrapolation of the linear portions of the curves gives the corrosion potential, Ecorr , and the corrosion current icorr. The corrosion rate may be determined from the corrosion current. H+ Summary: 4 http://www.energy-cie.ro/archives/2010/n1-1-14.pdf
Effects of Environment Effects on Business • Metal corrosion is greatly affected by it’s environment. • For instance, higher temperatures and higher velocity (or motion) of a metal correlates with higher corrosion rates. • Velocity effects are generally known as erosion corrosion. This is caused by the relative motion of the metal or it’s environment. • Erosion has many negative effects on the economy. • The main negative effect of corrosion on the economy is that many companies are often having to replace parts or machines due to corrosion which costs a large sum of money. Temperature and Corrosion Higher temperatures result in accelerated corrosion. Cooler temperatures cause less corrosion. 1. A practical application of corrosion is the anchors for radio/cell phone towers. 2. An actual tower support showing corrosion near the base. 3. Corrosion causes structural failure and the anchor support breaks. 4. Resulting catastrophe from failed support. http://4.bp.blogspot.com/_C_N3x2dSff0/SbJq8PC_dPI/AAAAAAAAAGc/2JxWr93cozc/s320/erosion_corrosion.jpg Summary: 5 http://www.corrosion-doctors.org/Corrosion-Factors-Cells/images/
Characteristics of Corrosion http://www.etftrends.com/wp-content/uploads/2010/10/gold-bars.jpg • Corrosion is defined as destructive and unintentional attack of metal • Corrosion is electrochemical and ordinarily begins at the surface. • Corrosion starts because of reactions with its surroundings. • Rust is a very common and well known form of corrosion • Some materials are intrinsically more resistant to corrosion (such as pure gold and silver), due to the nature of the electrochemical process. Pure gold and silver are intrinsically more resistant to corrosion http://www.ideaconnection.com/images/inventions/lg_coating-containing-friendly-bacteria-fight-corrosion.jpg http://www.monex.com/images/photos/prodSilver01.jpg
Factors of Corrosion http://www.corrosion-doctors.org/Corrosion-Factors-Cells/images/image011.jpg • Most of the time corrosion is destructive and undesirable. • Sometimes corrosion processes are used to our advantage. An example of this is etching procedures. • As shown in the table: Environment, Stress, Geometry, Temperature, and Time are important factors for different types of corrosion. http://nrqm.pbworks.com/f/1261611696/etching.jpg The Copper plate is being placed in a Ferrous Chloride solution which is quickly corroding the majority of the copper. A Protective ink layer has been placed over a specific area which allows other Microcircuits to be attached carrying current between only the specified places. This is how most large PCB computer components are made on a small scale.
Electrochemical Considerations • For a metallic material the corrosion process is normally electrochemical in nature. • This means that there is a transfer of electrons from one species to another. • In the figure electrons are being transferred from the Zinc anode to the Copper cathode, providing the current to light the bulb between the two electrodes. • Zinc is then electrochemically corroded and releases zinc ions into the aqueous solution. Electron current Release of Zn+2 ions (corrosion) Electrodepositing on surface of Cu(s) http://t1.gstatic.com/images?q=tbn:WrINNqxuXP-mFM:http://upload.wikimedia.org/wikipedia/en/thumb/2/2f/Galvanic_cell_with_no_cation_flow.png/400px-Galvanic_cell_with_no_cation_flow.png&t=1
Oxidation • Oxidation is when metal atoms characteristically lose or give up electrons. • General Equation for Oxidation is M Mn+ + ne- • The site at which oxidation takes place is called the Anode Figure: Oxidation of an iron bike over a large time. Inset shows the oxidation reaction between iron and the oxygen present in the atmosphere. Figure above shows the oxidation half reaction using a zinc electrode. The solid zinc gives up electrons and ions are released into solution. http://t1.gstatic.com/images?q=tbn:WrINNqxuXP-mFM:http://upload.wikimedia.org/wikipedia/en/thumb/2/2f/Galvanic_cell_with_no_cation_flow.png/400px-Galvanic_cell_with_no_cation_flow.png&t=1 http://nobelprize.org/nobel_prizes/chemistry/laureates/1992/illpres/oxidation.html
Example: Oxidation of Zinc • Oxidation of Zinc- The solid zinc (as indicated on the left side of the arrow) donates two electrons. • The two electrons along with the Aqueous Zn2+ are indicated on the right side of the arrow • The 2e- indicates that the Zinc is losing two electrons. • The Valence charge is also a good indication of how many electrons are being transferred Valence Charge 0 2+ Zn (s) Zn2+(aq) + 2e- The picture on the left shows a zinc bracket that has undergone slight oxidation (as evidenced by the spots of rust). The picture on the right shows a zinc tube that has not undergone oxidation. http://farm5.static.flickr.com/4058/4410488572_5d8d8e2c24.jpg http://www.insteellimited.com/images/DSCF0023.jpg
Reduction • Reduction is when a metal takes the electrons that are being transferred, reducing its charge. • The General equation for Reduction is Mn+ + ne- M • The Location at which the reduction occurs is called the Cathode Figure above shows the reduction half reaction using a copper electrode. Copper ions from solution are deposited on the surface of the metal as it accepts electrons. http://t1.gstatic.com/images?q=tbn:WrINNqxuXP-mFM:http://upload.wikimedia.org/wikipedia/en/thumb/2/2f/Galvanic_cell_with_no_cation_flow.png/400px-Galvanic_cell_with_no_cation_flow.png&t=1 Plating is an example of industrial and household application of the reduction concept http://cltad.arts.ac.uk/groups/camberwellmateriallibrary/wiki/53404/Electro-plating_.html
Example: Reduction of Copper • For the reduction of Copper, the process will add electrons to the copper as shown on the left hand side of the arrow • The two electrons are being added to the copper on the left side of the equation • The copper solid being produced has a neutral Valence charge as indicated on the right hand side of the arrow.. Valence Charge 2+ 0 Cu2+(aq) + 2e- Cu (s) The picture on the left shows a piece of copper metal that has undergone an oxidation reaction with atmospheric oxygen. The black surface of the metal is copper oxide. In the picture on the right, the metal is placed in a hydrogen gas environment. The hydrogen gas is a reducing agent. It reduces the copper oxide on the surface of the copper and causes pure copper to be formed. http://jchemed.chem.wisc.edu/JCESoft/CCA/CCA3/STILLS/REDOXCU/REDOXCU/64JPG48/5.JPG http://jchemed.chem.wisc.edu/JCESoft/CCA/CCA3/STILLS/REDOXCU/REDOXCU/64JPG48/14.JPG
Overall and Half Reactions Electrical Potential • An Overall Reaction is constructed of at least one oxidation and one reduction reaction and will be the sum of these two equations • The two separate reactions that are combined to make an overall reaction are the Half Reactions. • The oxidation reaction donates electrons and the reduction reaction accepts the electrons. • All electrons generated through oxidation must be consumed by reduction, thus there is no accumulation of electrons forms in solution. – Conservation of Net Charge Direction of Electron Flow Direction of Cation Flow Direction of Anion Flow Half Reactions http://www.webassign.net/blb8/20-05.gif
Example: Overall and Half Reactions • Reduction Half-Reaction • Oxidation Half-Reaction • Overall Reaction . Valence Charge 0 2+ Zn (s) Zn2+(aq) + 2e- Valence Charge 2+ 0 Cu2+(aq) + 2e- Cu (s) http://www.simarzincorame.com/images/zinc-rolled-sections-3.jpg Cu2+(aq) + 2e- + Zn(s) Cu(s) + Zn2+(aq) + 2e- Cu2+(aq) + Zn(s) Cu(s) +Zn2+(aq) This is an example of zinc that has been rolled into sheets for easy use. Zinc’s largest use is in corrosion protection. Galvanising is the main method of protection against corrosion of steel, i.e. the steel is coated with a layer of zinc in order to protect it from decay. This is an example of copper that is normally produced in industry for either household or business use. Usually metals that are going to sit on a shelf for a long period of time are coated with a corrosion resistant wax or petroleum jelly depending on the metal. http://www.etftrends.com/wp-content/uploads/2010/11/copper_1.jpg
Example 2: Overall and Half Reactions Cu(s) Cu2+(aq) + 2e- • Reduction Half-Reaction • Oxidation Half-Reaction • Overall Reaction 2 Ag1+(aq) + 2e- 2 Ag(s) http://static.seekingalpha.com/uploads/2009/7/13/saupload_silver_bars.jpg These silver bricks are used to keep track of large amounts of silver that is very highly valued. Silver is a natural anti-bacterial and is not very corrosive unless introduced to other metals and thus in industry silver rings are often used in processes where water is reused to keep bacteria from growing. Cu(s) Cu2+(aq) + 2e- 2 Ag1+(aq) + 2e- 2 Ag(s) 2 Ag1+(aq) + Cu(s) Cu2+(aq) + 2 Ag(s) This is another example of common copper tubes that would be produced in industry. Copper pipe is commonly used for plumbing/air conditioning/ refrigeration because of the amount of time that copper tubing lasts and its versatility. http://www.plumbinghelp.ca/images/Copper-Pipe.jpg
Electrode Potentials • Not all metallic substances oxidize to form ions with the same degree of ease which causes a movement of electrons when connecting two half cells. • A Standard Half-cell is a pure metal electrode immersed in a 1M solution of its ions at 25oC • When we connect the Standard Half-Cell to another Half-cell with a different metal, we can produce a Potential based on the difference in ease of movement of electrons. These are examples of multiple electrodes being used in a lab. These electrodes can be used to measure potential difference between metals as seen in the right picture, or an electrical charge can be induced to force a reaction as seen on the left http://www.discoverarmfield.co.uk/data/ceq/images/ceq2.jpg http://www.imagestate.com/Preview/PreviewPage.aspx?id=2218302
Electrode Potentials: Iron corrosion • For the picture to the right Iron corrodes while copper electrodeposits. • The Potential (voltage) between the two cells is the measure of the electron transfer, and for this system the Potential is .78V • As shown in the picture, both Electrodes are in a 1M solution of the electrodes’ ions. • A membrane is between the 2 solutions which allows the charge in the solution to stay constant http://www.knovel.com/web/portal/basic_search/display?_EXT_KNOVEL_DISPLAY_bookid=656
Electrode Potentials: Iron electrodepositing • This is different than the last example because now zinc is the electrode that is corroding and the iron has electrodepositing. • Notice that the Voltage direction and value has also changed. Electrons are now transferring from the Zinc to the Iron with a Potential of .323 http://www.knovel.com/web/portal/basic_search/display?_EXT_KNOVEL_DISPLAY_bookid=656
Galvanic Couple • Galvanic couple- a pair of substances (ex. two different metals) that when placed in a proper solution produces an electromotive force by chemical action. The electron flow indicates that this is a spontaneous reaction which transfers electron from the Zinc to the copper. Cathode Anode Zinc Sulfate Solution. Copper Sulfate Solution. • Electrolyte- any substance that dissociates into its separate ions when dissolved in a suitable medium or melted and thus makes the medium conductive. The Diaphragm allows ions to be transferred which equalizes charge and allows the continuation of electrons to flow http://www.pinkmonkey.com/studyguides/subjects/chem/chap9/c0909501.asp
Standardemf series • Standard emf Series- a series generated by coupling the standard hydrogen electrode to standard half-cells for various metals, and then ranking them according to measured voltage. • The standard hydrogen electrode consists of an inert platinum electrode in a 1M solution of H+ ions with Hydrogen gas bubbled through the solution. Standard Hydrogen Electrode http://www.ktf-split.hr/glossary/image/standard_hydrogen_electrode.gif http://www.matsceng.ohio-state.edu/mse205/lectures/chapter18/chap18_slide5.gif
This is the Standard emf Series Table for common Metals. This table is used to approximate Potential differences in a spontaneous cell for standard pressure and temperature conditions. The metal listed on the left corresponds with the electrode vs potential on the right. As you travel from the top of the table to the bottom of the table, the closer to the top that you are the more noble/Cathodic , the closer to the bottom the more active/anodic. Source: A.J. de Bethune and N.A.S. Loud “Standard Aqueous Electrode Potentials and Temperature Coefficient at 25 Celsius” Clifford A. Hampel Skokie, III. 1964 (Table 9-1)
Ni-Cu Cell • The reaction is a reduction reaction because one of the metals accepts electrons that flow from the other metal because it has a lower potential. Example Problem: Compute the voltage of an electrochemical cell at 25⁰C. Pure copper is immersed in a 1 M solution of Cu2⁺ ions and pure nickel is immersed in a 1 M solution of Ni2⁺ ions. Sample Calculation: Example of a simple Ni-Cu voltaic cell. http://www.tutorvista.com/topic/difference-between-galvanic-cell-and-voltaic-cell Ni2⁺ + 2e⁻ Ni V1⁰ = - 0.250 V Cu2⁺ + 2e⁻ Cu V2⁰ = 0.340 V Ni Ni2⁺ + 2e⁻ 0.250 V Cu2⁺ + 2e⁻ Cu 0.340 V ΔV⁰ = V2⁰ - V1⁰ 0.340 V - (-0.250 V) = 0.590 V Ni + Cu2⁺ Ni2⁺ + Cu 0.590 V
Spontaneity • Zn + Cu2+ Zn2+ + Cu • ΔV is positive in one direction, the direction in which the reaction is spontaneous. • If ΔV is negative then the reaction is spontaneous in the opposite direction. • The metal that has the higher potential will be reduced more. The reaction will proceed in the direction where that metal will act as a cathode. http://www.chem.tamu.edu/class/majors/tutorialnotefiles/electrochem.htm Zn2⁺ + 2e⁻ Zn V1 = - 0.763 V Cu2⁺ + 2e⁻ Cu V2⁰ = - 0.440 V Sample Calculation: ΔV⁰ = V2⁰ - V1⁰ spontaneous if ΔV⁰ > 0 non-spontaneous if ΔV⁰ < 0 ΔV⁰ = V2⁰ - V1⁰ (-0.440 V) - (-0.763 V) = 0.323 V The result of this calculation shows that electrons will spontaneously flow from Zn to Cu.
Nernst Equation • The Nernst Equation is used to find the cell potential of two half cells that are electrically coupled and for which solution ion concentrations are other than 1 M • V2 and V1- are the standard potentials as taken from the standard emf series • R- gas constant • T- temperature (K) • n- # of electrons participating in either of the half-cell reactions • F- faraday constant (96,500 C/mol) • [M1n+] and [M2n+]- molar ion concentrations of the two pure metals The solid line is a plot of the Nernst equation for potassium. http://www.unmc.edu/physiology/Mann/pix_3/f3-13.gif
Nernst Equation at Room Temperature • ΔV= (0.340 V – (-0.250 V)) - ln • = 0.590 V - 0.00891 V • = 0.58109 V (volts) Ni2⁺ + 2e⁻ Ni V1⁰ = - 0.250 V Conc. 2 M Cu2⁺ + 2e⁻ Cu V2⁰ = 0.340 V Conc. 1 M An example illustrating the Nernst equation and ion flow through a membrane. This is a special case of the Nernst equation which is only applicable at Room Temperature. http://science.widener.edu/~svanbram/chem366/echem.pdf
Nernst Equation Applied to Alloys These values, [M1] and [M2], will be = 1M for pure metals < 1M for alloys • V2 and V1- are the standard potentials • R- gas constant • T- temperature (K) • n- # of electrons participating • F- faraday constant • [M1n+] and [M2n+]- molar ion concentrations • [M1] and [M2] - molar concentrations of metals in the two alloys • For alloys composition must be considered, so the Nernst Equation is modified to include [M1] and [M2]. This is because the molar concentrations of the metal ions in solution will not have concentrations of 1. Therefore it is necessary to include the initial concentrations of the metals in the alloys. Several Metal Alloys http://t2.gstatic.com/images?q=tbn:Efj-LqaM8KC4-M:http://en.fukesi.com/img/product_pic/50156036_Aluminum_Alloy_Profile.jpg&t=1 http://www.doitpoms.ac.uk/tlplib/pourbaix/nersnt_detailed.php
Influence of concentration and temperature on cell potential • The cell potential relies heavily on the temperature and molar ion concentrations • Altering the temperature or solution concentrations will change the cell potential and in some cases reverse a spontaneous reaction. • According to the Nernst equation, as you increase temperature the potential decreases and thus becomes less and less spontaneous. Concentration of a solution refers to the weight or volume of solute in a specified amount of solution or solvent. According to chem.purdue.edu, it is a macroscopic property, meaning it describes the behaviors or characteristic of a sample which is large enough to see, weigh, manipulate, handle, etc. http://www.thedailygreen.com/media/cm/thedailygreen/images/refridgerator-thermometer-l.jpg Solutions of varying concentrations. http://4.bp.blogspot.com/_e096-J02yVY/TAtuocstqgI/AAAAAAAAAkU/iBpiQp4s5fI/s400/concentration.jpg
Galvanic Series • The galvanic series (or electropotential series) determines the nobility of metals and semi-metals. When two metals are submerged in an electrolyte, while electrically connected, the less noble (base) will experience galvanic corrosion. The rate of corrosion is determined by the electrolyte and the difference in nobility. The difference can be measured as a difference in voltage potential. Galvanic reaction is the principle upon which batteries are based. • The Galvanic series is a much more practical and realistic ranking system than the standard emf series, because the standard emf series is generated under highly idealized conditions. • In nature nearly all metals occur as compounds. This is because there is a net decrease in free energy in going from metallic to oxidized states, which essentially means that the reaction is spontaneous. Common compounds are oxides, hydroxides, carbonates, silicates, sulfides, and sulfates. • The exception to this rule is the noble metals gold and platinum. These metals are in their metallic state in nature. Case One This figure demonstrates different scenarios in which potential will or will not be generated. The galvanic series deals with creating potential through connecting dissimilar metals in a conductive solution, as shown in Case One. http://www.enviroscan.com/assets/images/galvanic_corrosion_cells.jpg
Galvanic Series of Metals • More Cathodic Metals are Less active (more inert) and have a higher potential. Platinum is listed as the most Cathodic metal and is thus very unreactive • More Anodic Metals are more active (less inert) and have lower potentials. The most Anodic matal is listed as Magnesium and is thus is very active and has the highest potential http://www.amacgroup.com.au/library/images/corrosion/The-Galvanic-Series-of-Meta.gif
Corrosion Rates • Corrosion rates are very important design parameter for engineers because corrosion can destroy process piping and damage equipment if not accounted for properly. • The corrosion rate is calculated as the rate of material removal as a consequence of chemical actions. • We can calculate the corrosion penetration rate (CPR) which is the actual rate of removal of material. • If corrosion is not calculated correctly major processes can be completely shut down to fix a corroded section of the process, which will cause a company to incur significant costs. • According to the US Department of Energy, Corrosion does more economic damage than the effect of all natural disasters combined. Corrosion costs industry approximately 5% of the Gross National Product. Examples of Industrial Corrosion and Corrosion Prevention http://www.bushman.cc/photos/Commercial_Hot_Water_Heat_Tube_Corrosion.jpg http://www.nansulate.sk/magyar/images/industrial_1.jpg
Corrosion Penetration Rate • The rate of material removed as a consequence of chemical reaction is given by: • W- is the weight loss after exposure time • p- Density • A- exposed surface area • t- exposure time • K- is a constant • Defined as 87.6 for mm/year (mm/yr) • Defined as 534 for mils/year (mpy) • (where 1mil = .001 in) The figure above shows “Pitting Corrosion.” Pitting is a particularly dangerous form of corrosion. Rate of penetration can be 10 to 100 times that by general corrosion. For most applications, an acceptable Corrosion Penetration Rate (CPR) is 20 mpy. http://backup.exprobase.com/docs/Illustrations/Databases/Failure%20mechanisms/Pitting%20corrosion.png
Alternative Corrosion Rate Expression • r- rate in mol/m^2*s • i- current density( current per unit surface area of material corroding) • n- number of electrons with ionization of each metal atom • F- 96,500 C/mol This figure shows the corrosion of steel over time. http://people.csail.mit.edu/wojciech/TSVBRDF/TSVBRDF.pdf
Prediction of corrosion rates • When an electrochemical cell which has been short circuited such that oxidation occurs at the respective electrode surfaces, we can not use standard emf values. This is because the system is no longer at an equilibrium state. The difference between the standard emf value and the actual Potential is termed Polarization. The Magnitude of Polarization is termed overvoltage. These are pictures of corrosion in the form of rust forming on the surface of metals. http://wpcontent.answcdn.com/wikipedia/commons/thumb/5/55/Rust03102006.JPG/225px-Rust03102006.JPG http://www.munters.com/AvanMediaBank/Image/%7B2C83A853-5A03-49AE-9E78-77A92967E3C5%7D/width_439/height_124/Bar_Corrosion02.jpg
Activation Polarization This figure shows the activation polarization process. • An electrochemical reaction consists of a sequence of steps at the interface between the metal electrode and the electrolyte solution. • Activation Polarization refers to when the reaction rate is controlled by the slowest step in the series. • The term “activation” is applied to this type of polarization because an activation energy barrier is associated with this slowest, rate limiting step. • There are 4 proposed steps for activation polarization, which will be explained in the following slides • Adsorption of H+ ions from the solution onto the metallic surface. • Electron transfer from metallic surface to form a hydrogen atom. • Combining of two hydrogen atoms to form hydrogen molecule • The coalescence of many hydrogen molecules to form a bubble. http://www.providenceri.com/publicworks/hurricane/activation_polarization.gif
Activation Polarization Step 1: Adsorption of H+ ions onto the zinc surface. • The reaction takes place in a solution containing H+ ions. • These ions will adsorb to the surface of the submerged metal. • This step will be the rate limiting step if there are a limited number of H+ ions in solution. In an acidic solution, where there are an abundance of H+ ions, this will most likely not be the slow step. http://www.providenceri.com/publicworks/hurricane/activation_polarization.gif
Activation Polarization Step 2: Electron transfer from the metal to form a hydrogen atom • This step involves the rate at which electrons travel through the metal. • There is a wide range of transfer rates of electrons by various metals and, as a result, the rate of hydrogen evolution from different metal surfaces can vary greatly. • In most reaction sequences this step will be the most important in determining overall reaction rate. http://www.providenceri.com/publicworks/hurricane/activation_polarization.gif
Activation Polarization Step 3: Combining of two hydrogen atoms to form a molecule of hydrogen • This step depends on the location of hydrogen ions in relation to one another on the surface of the metal. • If the concentration on of ions on the surface is low, this step will be limiting as the ions will not come into contact with other ions with which they can form a molecule as frequently as if the surface concentration is high. http://www.providenceri.com/publicworks/hurricane/activation_polarization.gif
Activation Polarization Step 4: Bubble formation • The final step is the combining of many hydrogen molecules to form a hydrogen gas bubble. • This bubble is then diffused through the solution and evolved at the liquid surface. This evolution of hydrogen gas can be used by the observer to confirm the reaction is proceeding. • This will very rarely be the rate determining step. http://www.providenceri.com/publicworks/hurricane/activation_polarization.gif
Activation Polarization • - overvoltage • - current density • and -constants for a particular half-cell • A plot of overvoltage vs. the logarithm of current density exhibits a linear relationship with a slope of β. • This relationship holds for both the anodic and cathodic reactions. http://electrochem.cwru.edu/encycl/fig/c02/c02-f03b.gif
Activation Polarization • Equilibrium is actually a dynamic state on the atomic level. • Equilibrium exists for a half-cell when the rate of reduction is equal to the rate of oxidation, so there is no net reaction. • i0 is the “exchange current density” and is measured experimentally for each system • Equation at equilibrium: This figures shows area in curve where corrosion takes place and hydrogen is liberated as in the previous example. http://nautarch.tamu.edu/crl/images/fig9-1.jpg
Concentration Polarization • Concentration polarization is the polarization component that is caused by concentration changes in the environment adjacent to the surface. • When a chemical species participating in a corrosion process is in short supply, the mass transport of that species to the corroding surface can become rate controlling. http://corrosion-doctors.org/Corrosion-Kinetics/Overpotential-concentration.htm
Concentration Polarization At slow reaction rates and/or high concentrations there is always a sufficient amount of ions available near the electrode surface, allowing the reaction to proceed unhindered. H+ Cathode This figure shows a situation where hydrogen ions in solution are present in ample supply to feed the reduction reaction. The ions will be available at the surface of the metal to accept electrons that are produced during the reaction. H+ H+ H+ H+ H+ H+ H+ H+ *Team generated graphic. H+ H+ H+ NOT concentration limited.
Concentration Polarization The reaction rate in concentration polarization is limited by the diffusion of ions in solution. At high reaction rates or low concentrations a depletion zone will form near the electrode surface, in which the ions are not replaced fast enough to keep up with the rate of reaction. Depletion Zone The figure to the left illustrates the presence of a depletion zone near the surface of a metal cathode. Depletion zones can form when reaction rate is high or solution concentration is low. This system is said to be concentration polarized. H+ H+ Cathode + Overvoltage, nc iL H+ H+ H+ 0 *Team generated graphic. H+ Concentration limited H+ When overvoltage is plotted vs. the logarithm of current density, the result is a nonlinear graph that approaches a constant value, iL- the limiting diffusion current density. A reaction that is concentration polarized is described by the following equation: - H+ Log current density, i *Team generated graphic.
Combination Polarization • As shown in the figure below, this reaction is limited by both activation and concentration polarization. • This graph is representative of combination Polarization and is Overvoltage vs Log current Density The first part of the curve is linear with a slope of –β. + i0 0 The slope of the second part of the curve decreases rapidly as the current density approaches iL. Activation Polarization - Overvoltage, nc Concentration Polarization iL Log current density, i *Team generated graphic.
Corrosion rates from Polarization Data • When both oxidation and reduction reactions are rate limited by activation polarization: • The intersection of the extrapolation of the linear portions of the curves gives the corrosion potential, Ecorr , and the corrosion current icorr. • The corrosion rate may be determined from the corrosion current. Intersection The figures demonstrate the use of graphs to predict corrosion rates from activation polarization data. http://www.gamry.com/App_Notes/DC_Corrosion/GettingStartedWithEchemCorrMeasurements.htm#Quantitative Corrosion Theory http://www.energy-cie.ro/archives/2010/n1-1-14.pdf
Corrosion Rates from Polarization Data • When both concentration and activation polarization control the reduction reaction: The figure to the left shows a reduction reaction under combined activation-concentration polarization control. The hydrogen is concentration limited while the metal corrosion behavior is described by activation polarization. The intersection of the graphs of each materials’ polarization data gives the corrosion potential and corrosion current. Corrosion rate is then calculated using the equation: (H+/H2) i0 Potential, V (M/M2+) Vcorr , icorr *Team generated graphic. *The total overvoltage is the sum of both overvoltage contributions. iL Log current density, i
Passivity • Passivity is the characteristic of a metal exhibited when that metal does not become active in the corrosion reaction. Passivity is caused by the buildup of a stable, tenacious layer of metal oxide on the surface of the metal. • Stainless steels and aluminum are highly resistant to corrosion as a result of passivation. Stainless steels contain chromium allowing the formation of a protective surface film in an oxidizing atmosphere which reduces rusting. Aluminum also forms a protective film and its film is able to reform very rapidly if damaged to prevent corrosion. http://www.concretecorrosion.net/imgen/suite/corrosion/schema1.gif The figure above illustrates the corrosion process for a material exhibiting passivity characteristics. http://www.tpub.com/content/doe/h1015v1/css/h1015v1_108.htm
Passivity As shown in the figure: Transpassive Region: At very high potentials, the current density again begins to increase with increasing potential. Passive Region: With increasing potential, current density suddenly drops to a very low value that is independent of potential. Active Region: At low potentials, behavior is linear for normal metals. http://www.industrialheating.com/IH/Home/Images/ih0308-vst-fig.1-lg.jpg
Effects of Environment on Corrosion • Metal corrosion is greatly affected by it’s environment. • For instance, higher temperatures and higher velocity (or motion) of a metal correlates with higher corrosion rates. • Velocity effects are generally known as erosion corrosion. This is caused by the relative motion of the metal or it’s environment. Temperature and Corrosion Progression of corrosion. EROSION Cooler temp. Higher temp. http://4.bp.blogspot.com/_C_N3x2dSff0/SbJq8PC_dPI/AAAAAAAAAGc/2JxWr93cozc/s320/erosion_corrosion.jpg http://www.thewatertreatments.com/wp-content/uploads/2009/12/corrosion-stages.JPG