Download

1 / 12
120 likes | 254 Vues
Anisotropy Studies in the Pierre Auger Observatory. Beatriz Blanco Siffert for the Auger Collaboration Instituto de Física - Universidade Federal do Rio de Janeiro. I - Introduction.

E N D
Anisotropy Studies in the Pierre Auger Observatory Beatriz Blanco Siffert for the Auger Collaboration Instituto de Física - Universidade Federal do Rio de Janeiro
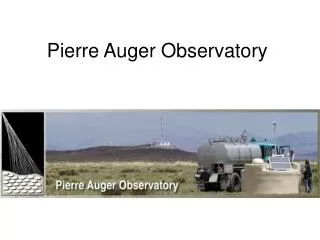
I - Introduction One of the aims of the Pierre Auger observatory is to determine the origin of Ultra High Energy Cosmic Rays. The observatory produces maps with the reconstructed arrival direction of the detected cosmic rays and we analyze this maps and try to determine whether they are isotropic or not. We have to look for sources (not necessarily bright) or for large scale anisotropies hidden behind the background. And worse: even this background is tricky, because, due to the detector features, it itself will not be isotropic.
II - Coverage Determination • Before searching for anisotropies, we need to know the influence of the detector features in the determination of the background. We need to determine as precisely as possible the probability that the detector sees the cosmic rays as a function of its arrival direction. This probability is the so called “Coverage” or “Exposure” of the experiment. • There are two methods currently in use in the Auger experiment to determine it’s coverage: • The Shuffling [2] or Scrambling method; • The Fitting [3,4] method.
Both methods are based on real data obtained by Auger. The Shuffling Method The Fitting Method • Make 5 bins of zenith angles uniformly in cos(theta) between cos(theta)=1.0 and cos(theta)=0.5. • The coverage map will be the average of many simulation data sets. • Make a histogram of the zenith angle distribution of the events for all RA values and fit it with a polynomial; • Convert the smoothed distribution obtained from zenith angle to declination; • Generate the coverage map according to the distribution obtained for declination and assuming a flat dependence in RA. • To produce a simulation data set of N directions, sample N arrival directions from the real data set. • For each one, keep the zenith angle, but sample a new sidereal time and a new azimuth from two other events in the same zenith • angle bin.
An advantage of the shuffling method is that it conserves the RA distribution of the events, in case it is not really flat. A disadvantage is the fact that if a true anisotropy reflects itself mainly in the RA distribution it will be washed out by this method. Coverage map obtained with the shuffling method [5].
A difficulty of the fitting method is that it assumes that the detection probability is independant of RA and, if this is not the case, one must correct for it or else we will detect a spurious signal. Coverage map obtained from the fitting method [5]:
III - Anisotropy Search The Angular Power Spectrum Analysis We may define an Intensity function for the maps containing N events. This function can be expanded in the Spherical Harmonics basis [6]: The Angular Power Spectrum is estimated as:
This intensity function is not, however, measured uniformly over the whole celestial sphere because of the non-uniform exposure of the experiment. What we have available from the data is: Where W(,) is the window function that represents the exposure. We have then only access to the power spectrumof the product of these two functions. The good thing is that we can estimate the true power spectrum from the measurement of , as can be seen in [7]. Variations on an angular scale of radians contribute in the mode l = 1/.
This is the power spectrum reconstructed from a pure dipole input [7].
IV – Conclusion and Prospects • In order to look for anisotropy patterns we need first to determine the coverage map; • Efforts are still being made to try to determine the best method to estimate the coverage map; • The angular power spectrum is a good method to look for anisotropy in the data maps. Other methods are also being studied and developed;
References: [1] Summary of the 1st Auger Anisotropy Workshop [2] Clay R, 2003 astro-ph/0308494 [3] Internal GAP note 2003 105 [4] Internal GAP note 2004 040 [5] http://lpnhe-auger.in2p3.fr/priv/AARGH/CompareCoverage/compcov.html [6] Sommers P, 2000 astro-ph/0004016 [7] Deligny O et al, 2004 JCAP 10 008