Download
1 / 1
10 likes | 192 Vues
A Population PK Model For Citalopram And Its Major Metabolite, N- desmethyl Citalopram, In Rats. Nieves Velez de Mendizabal 1, 2 , Kimberley Jackson 3 , Brian Eastwood 4 , Steven Swanson 5 , David M. Bender 5 , Stephen Lowe 6 , Robert R. Bies 1, 2.

E N D
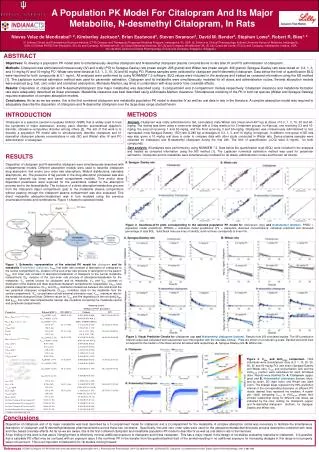
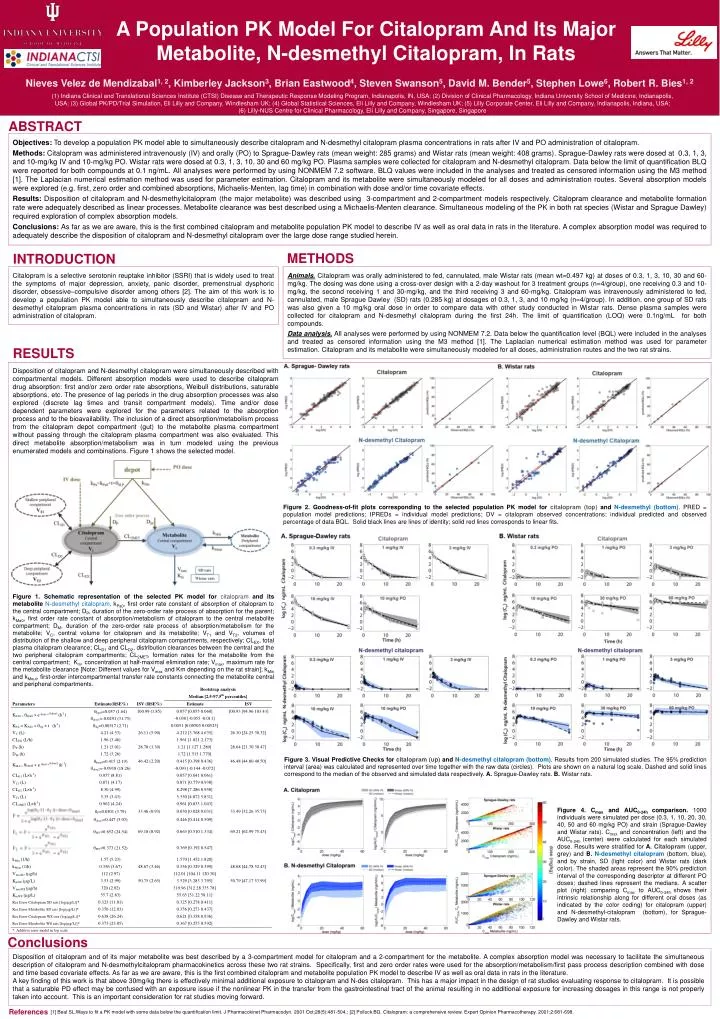
A Population PK Model For Citalopram And Its Major Metabolite, N-desmethyl Citalopram, In Rats Nieves Velez de Mendizabal1, 2, Kimberley Jackson3, Brian Eastwood4, Steven Swanson5, David M. Bender5, Stephen Lowe6, Robert R. Bies1, 2 (1) Indiana Clinical and Translational Sciences Institute (CTSI) Disease and Therapeutic Response Modeling Program, Indianapolis, IN, USA; (2) Division of Clinical Pharmacology, Indiana University School of Medicine, Indianapolis, USA; (3) Global PK/PD/Trial Simulation, Eli Lilly and Company, Windlesham UK; (4) Global Statistical Sciences, Eli Lilly and Company, Windlesham UK; (5) Lilly Corporate Center, Eli Lilly and Company, Indianapolis, Indiana, USA; (6) Lilly-NUS Centre for Clinical Pharmacology, Eli Lilly and Company, Singapore, Singapore ABSTRACT Objectives: To develop a population PK model able to simultaneously describe citalopram and N-desmethyl citalopram plasma concentrations in rats after IV and PO administration of citalopram. Methods: Citalopram was administered intravenously (IV) and orally (PO) to Sprague-Dawley rats (mean weight: 285 grams) and Wistar rats (mean weight: 408 grams). Sprague-Dawleyrats were dosed at 0.3, 1, 3, and 10-mg/kg IV and 10-mg/kg PO. Wistar rats were dosed at 0.3, 1, 3, 10, 30 and 60 mg/kg PO. Plasma samples were collected for citalopram and N-desmethyl citalopram. Data below the limit of quantification BLQ were reported for both compounds at 0.1 ng/mL. All analyses were performed by using NONMEM 7.2 software. BLQ values were included in the analyses and treated as censored information using the M3 method [1]. The Laplacian numerical estimation method was used for parameter estimation. Citalopram and its metabolite were simultaneously modeled for all doses and administration routes. Several absorption models were explored (e.g. first, zero order and combined absorptions, Michaelis-Menten, lag time) in combination with dose and/or time covariate effects. Results: Disposition of citalopram and N-desmethylcitalopram(the major metabolite) was described using 3-compartment and 2-compartment models respectively. Citalopram clearance and metabolite formation rate were adequately described as linear processes. Metabolite clearance was best described using a Michaelis-Menten clearance. Simultaneous modeling of the PK in both rat species (Wistar and Sprague Dawley) required exploration of complex absorption models. Conclusions: As far as we are aware, this is the first combined citalopram and metabolite population PK model to describe IV as well as oral data in rats in the literature. A complex absorption model was required to adequately describe the disposition of citalopram and N-desmethyl citalopram over the large dose range studied herein. METHODS INTRODUCTION Animals.Citalopram was orally administered to fed, cannulated, male Wistar rats (mean wt=0.497 kg) at doses of 0.3, 1, 3, 10, 30 and 60-mg/kg. The dosing was done using a cross-over design with a 2-day washout for 3 treatment groups (n=4/group), one receiving 0.3 and 10-mg/kg, the second receiving 1 and 30-mg/kg, and the third receiving 3 and 60-mg/kg. Citalopram was intravenously administered to fed, cannulated, male Sprague Dawley (SD) rats (0.285 kg) at dosages of 0.3, 1, 3, and 10 mg/kg (n=4/group). In addition, one group of SD rats was also given a 10 mg/kg oral dose in order to compare data with other study conducted in Wistar rats. Dense plasma samples were collected for citalopram and N-desmethyl citalopram during the first 24h. The limit of quantification (LOQ) were 0.1ng/mL for both compounds. Data analysis.All analyses were performed by using NONMEM 7.2. Data below the quantification level (BQL) were included in the analyses and treated as censored information using the M3 method [1]. The Laplacian numerical estimation method was used for parameter estimation. Citalopram and its metabolite were simultaneously modeled for all doses, administration routes and the two rat strains. Citalopram is a selective serotonin reuptake inhibitor (SSRI) that is widely used to treat the symptoms of major depression, anxiety, panic disorder, premenstrual dysphoric disorder, obsessive–compulsive disorder among others [2]. The aim of this work is to develop a population PK model able to simultaneously describe citalopram and N-desmethyl citalopram plasma concentrations in rats (SD and Wistar) after IV and PO administration of citalopram. RESULTS Disposition of citalopram and N-desmethyl citalopram were simultaneously described with compartmental models. Different absorption models were used to describe citalopram drug absorption: first and/or zero order rate absorptions, Weibull distributions, saturable absorptions, etc. The presence of lag periods in the drug absorption processes was also explored (discrete lag times and transit compartment models). Time and/or dose dependent parameters were explored for the parameters related to the absorption process and to the bioavailability. The inclusion of a direct absorption/metabolism process from the citalopram depot compartment (gut) to the metabolite plasma compartment without passing through the citalopram plasma compartment was also evaluated. This direct metabolite absorption/metabolism was in turn modeled using the previous enumerated models and combinations. Figure 1 shows the selected model. Figure 2. Goodness-of-fit plots corresponding to the selected population PK model for citalopram (top) and N-desmethyl (bottom).PRED = population model predictions; IPREDs = individual model predictions; DV = citalopram observed concentrations; individual predicted and observed percentage of data BQL. Solid black lines are lines of identity; solid red lines corresponds to linear fits. Figure 1. Schematic representation of the selected PK model for citalopram and its metabolite N-desmethyl citalopram. kPa0, first order rate constant of absorption of citalopram to the central compartment; DP, duration of the zero-order rate process of absorption for the parent; kMa0, first order rate constant of absorption/metabolism of citalopram to the central metabolite compartment; DM, duration of the zero-order rate process of absorption/metabolism for the metabolite; VC, central volume for citalopram and its metabolite; VT1 and VT2, volumes of distribution of the shallow and deep peripheral citalopram compartments, respectively; CLEX, total plasma citalopram clearance; CLD1 and CLD2, distribution clearances between the central and the two peripheral citalopram compartments; CL2MET, formation rates for the metabolite from the central compartment; Km, concentration at half-maximal elimination rate; Vmax, maximum rate for the metabolite clearance [Note: Different values for Vmax and Km depending on the rat strain]; kMin and kMout, first-order intercompartmental transfer rate constants connecting the metabolite central and peripheral compartments. Figure 3. Visual Predictive Checks for citalopram (up) and N-desmethyl citalopram (bottom).Results from 200 simulated studies. The 95% prediction interval (area) was calculated and represented over time together with the raw data (circles). Plots are shown on a natural log scale. Dashed and solid lines correspond to the median of the observed and simulated data respectively. A. Sprague-Dawley rats. B. Wistar rats. Figure 4. Cmax and AUC0-24h comparison. 1000 individuals were simulated per dose (0.3, 1, 10, 20, 30, 40, 50 and 60 mg/kg PO) and strain (Sprague-Dawley and Wistar rats). Cmax and concentration (left) and the AUC0-24h (center) were calculated for each simulated dose. Results were stratified for A. Citalopram(upper, grey) and B. N-desmethyl citalopram (bottom, blue), and by strain, SD (light color) and Wistar rats (dark color). The shaded areas represent the 90% prediction interval of the corresponding descriptor at different PO doses; dashed lines represent the medians. A scatter plot (right) comparing Cmax to AUC0-24h shows their intrinsic relationship along for different oral doses (as indicated by the color coding) for citalopram (upper) and N-desmethyl-citalopram (bottom), for Sprague-Dawley and Wistar rats. Conclusions Disposition of citalopram and of its major metabolite was best described by a 3-compartment model for citalopram and a 2-compartment for the metabolite. A complex absorption model was necessary to facilitate the simultaneous description of citalopram and N-desmethylcitaloprampharmacokinetics across these two rat strains. Specifically, first and zero order rates were used for the absorption/metabolism/first pass process description combined with dose and time based covariate effects. As far as we are aware, this is the first combined citalopram and metabolite population PK model to describe IV as well as oral data in rats in the literature. A key finding of this work is that above 30mg/kg there is effectively minimal additional exposure to citalopram and N-des citalopram. This has a major impact in the design of rat studies evaluating response to citalopram. It is possible that a saturable PD effect may be confused with an exposure issue if the nonlinear PK in the transfer from the gastrointestinal tract of the animal resulting in no additional exposure for increasing dosages in this range is not properly taken into account. This is an important consideration for rat studies moving forward. References [1] Beal SL.Ways to fit a PK model with some data below the quantification limit. J PharmacokinetPharmacodyn. 2001 Oct;28(5):481-504.; [2] Pollock BG. Citalopram: a comprehensive review. Expert Opinion Pharmacotherapy. 2001;2:681-698.