Download
1 / 1
10 likes | 187 Vues
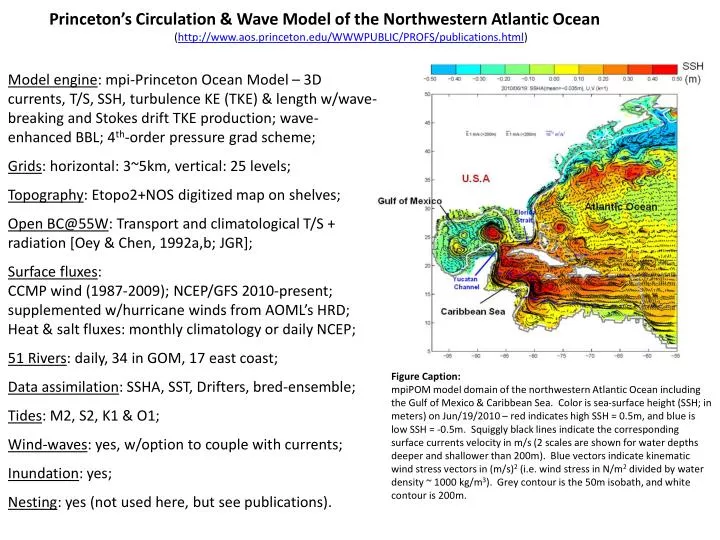
Princeton’s Circulation & Wave Model of the Northwestern Atlantic Ocean ( http://www.aos.princeton.edu/WWWPUBLIC/PROFS/publications.html ).

E N D
Princeton’s Circulation & Wave Model of the Northwestern Atlantic Ocean (http://www.aos.princeton.edu/WWWPUBLIC/PROFS/publications.html) Model engine: mpi-Princeton Ocean Model – 3D currents, T/S, SSH, turbulence KE (TKE) & length w/wave-breaking and Stokes drift TKE production; wave-enhanced BBL; 4th-order pressure grad scheme; Grids: horizontal: 3~5km, vertical: 25 levels; Topography: Etopo2+NOS digitized map on shelves; Open BC@55W: Transport and climatologicalT/S + radiation [Oey & Chen, 1992a,b; JGR]; Surface fluxes: CCMP wind (1987-2009); NCEP/GFS 2010-present; supplemented w/hurricane winds from AOML’s HRD; Heat & salt fluxes: monthly climatology or daily NCEP; 51 Rivers: daily, 34 in GOM, 17 east coast; Data assimilation: SSHA, SST, Drifters, bred-ensemble; Tides: M2, S2, K1 & O1; Wind-waves: yes, w/option to couple with currents; Inundation: yes; Nesting: yes (not used here, but see publications). Figure Caption: mpiPOM model domain of the northwestern Atlantic Ocean including the Gulf of Mexico & Caribbean Sea. Color is sea-surface height (SSH; in meters) on Jun/19/2010 – red indicates high SSH = 0.5m, and blue is low SSH = -0.5m. Squigglyblack lines indicate the corresponding surface currents velocity in m/s (2 scales are shown for water depths deeper and shallower than 200m). Blue vectors indicate kinematic wind stress vectors in (m/s)2 (i.e. wind stress in N/m2 divided by water density ~ 1000 kg/m3). Grey contour is the 50m isobath, and white contour is 200m.


![Figure 9.1 Flow graph of 1 st -order complex recursive computation of X [ k ].](https://cdn3.slideserve.com/5826681/figure-9-1-flow-graph-of-1-st-order-complex-recursive-computation-of-x-k-dt.jpg)