Download
1 / 12
120 likes | 204 Vues
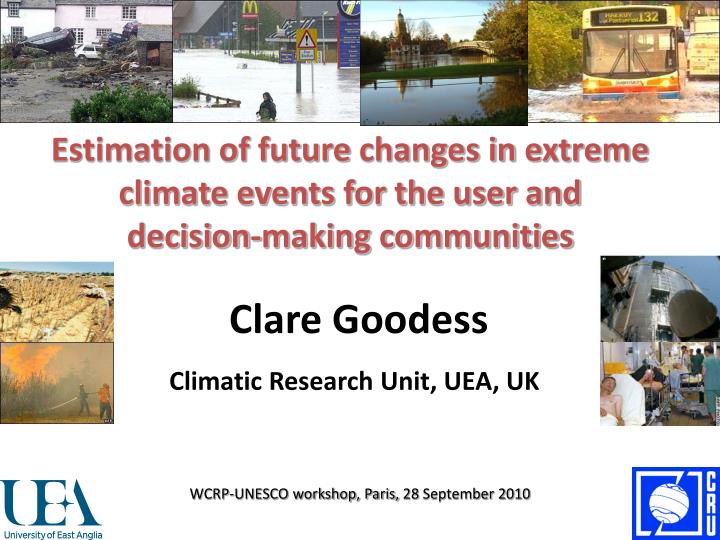
Estimation of future changes in extreme climate events for the user and decision-making communities. Clare Goodess. Climatic Research Unit, UEA, UK. WCRP-UNESCO workshop, Paris, 28 September 2010. Who are the ‘users’? What do they want?. Diverse Depends on application.

E N D
Estimation of future changes in extreme climate events for the user and decision-making communities Clare Goodess Climatic Research Unit, UEA, UK WCRP-UNESCO workshop, Paris, 28 September 2010
Who are the ‘users’? What do they want? Diverse Depends on application • Impacts modellers (research community) • Decision/policy makers: e.g., urban/built environment - planners, local/regional authorities, service/building engineers, architects, small businesses, consultants, professional bodies • Impact sectors: water, agriculture, health, tourism and visitor economy, insurance, energy, transport………………………… • National climate change projections (UKCP09) • Urban system modelling • Development of codes of practice (building services) • Assessment of vulnerability to current extremes • Integrated assessments based on indicators (Mediterranean)
UKCP09 national climate change projections probabilistic projections over land weather generator daily time series monthly/ seasonal PDFs http://ukclimateprojections.defra.gov.uk/
Tailoring of information: extremes (spatial & temporal scales), processes, presentation (tools) e.g., SCORCHIO: the Urban Heat Island and the SCHEEME decision-making tool McCarthy et al., IJC, submitted
Risk map Overview of the components of SCORCHIO and the SCHEEME tool prototypes
Design Summer Years (DSYs) for use in building performance models DSY: April-Sept mean T Mid-year of the upper quartile Based on 1983-2004 • Challenges for the user community: • Current DSYs don’t represent present extremes • Need to handle climate variability as well as change • Need to work with uncertainty (e.g., multiple emissions scenarios) • And now need to work with probabilities (UKCP09) • Range of ‘users’: engineers/consultants, architects & their clients • And for ‘producers’: e.g., weighted cooling degree hours CIBSE TM36, 2005
Can help local authorities to achieve National Indicator NI188 ‘Planning to adapt to climate change’ Local climate impacts profile (LCLIP) Extremes are at the heart of many impact assessments and moves towards adaptation Business areas climate impacts assessment (BACLIAT)
Tools such as UKCP09 weather generator and threshold detector can inform LCLIPs/BACLIATs 1 Average annual number of heat waves (Heat Weather Watch Plan definition: Tn > 15°C & Tx > 30°C for at least 2 consecutive days) for Cambridge for baseline (left) and future periods (2020s medium emissions; 2050s low, medium and high emissions). Upper and lower 95% confidence intervals across 100 weather generator runs/change factors are shown. 0 L M H 61-90 2020s 2050s • But can’t provide information about all requested extremes (especially compound events) • And some problems with persistence of extremes • And equivalent information from local observations is often not available
Importance of ‘benchmarking’ http://www.ensembles-eu.org/Final conference: Giannakopoulos
Multi-model RCM ensembles and extremes http://www.ensembles-eu.org/Final conference: Giannakopoulos
What is it? What does it show? Why is it important? Climate indicators in the CIRCE case-study integrated assessments e.g. Athens urban case study Very hot nights: Tn95 summer = 26°C Figure 3: Annual number of very hot nights, anomalies from the 1971-2000 average (left axis, bars) for the NOA station.10-year moving average of very hot nights (right axis, solid line) http://www.cru.uea.ac.uk/projects/circe/index.html
Some concluding remarks • Focus on Temp and Prec (gaps: wind, hail ........ and particularly compound events/sequences) • Focus on ‘moderate’ extremes indices based on 5/10th and 90/95th percentiles (subsets from STARDEX/ETCCDI) often with user-friendly names (e.g. hot/tropical nights) • Compromise between robustness and relevance/resonance for impacts and users • Tailoring to very diverse and growing needs vs consistency and comparability (monitoring and integrated assessment) • Communication of uncertainty is increasingly important and complex • Are there some needs we shouldn’t be trying to meet (e.g., very high spatial/temporal resolution)? Thank you!