Download
1 / 37
370 likes | 499 Vues
The Use Of ATPC For Interference Mitigation In The Rain Outage Dominated Frequency Bands. NSMA Annual Conference May 18-19, 2004 Arlington, VA. Robert Ferguson MCI Incorporated 972-729-5129 Robert.Ferguson@mci.com.

E N D
The Use Of ATPC For Interference Mitigation In The Rain Outage Dominated Frequency Bands NSMA Annual Conference May 18-19, 2004 Arlington, VA Robert Ferguson MCI Incorporated 972-729-5129 Robert.Ferguson@mci.com
Use Of ATPC As A Coordination AdvantageLower Frequency (Non-Rain-Dominated) Bands • Selected Assumptions • Path P Has Adequate Clearance • Site P0 Is ATPC Equipped, A “Coordinated Tx Pwr” Is Claimed • When Fading Is Present, P0 Is Permitted To Increase Tx Pwr Above Coordinated (Co Tx Pwr) Up To 10 dB, Subject To Limitations • Tx Pwr > Co Tx Pwr For 0.50%,…, • Tx Pwr > Co Tx Pwr + 5 dB For 0.07%,…, • Tx Pwr = Co Tx Pwr + 10 dB For 0.01% • A Minimum Fade Of 10 dB Must Be Present Before Tx Pwr Goes Above Co Tx Pwr 1 0 D P I 1 0 The ATPC Coordination Advantage Assumes Deep Fades On Path D And Elevated Tx Pwr At P0 Are Uncorrelated (Rarely Occur Simultaneously) Due To Low Frequency Fading Characteristics; No Assumptions On Path I Are Required
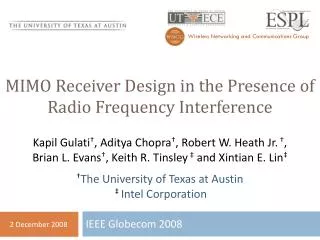
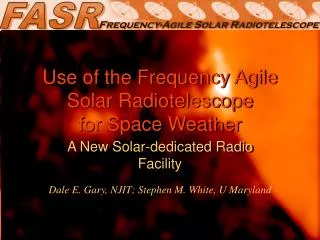
ATPC In Higher (Rain-Dominated) Frequency Bands P – ATPC Equipped Path D – Desired Path I – Interfering Path P0>D0 1 0 D P Path Lengths & Angles, In Relation To Rain Cell Patterns, Determine Degree Of Fading Correlation I 1 0 During A Rain Event, A Fade On Path P Of Sufficient Depth To Cause ATPC To Increase Tx Pwr P0 May Occur Simultaneously With A Fade On Path D; In General, Use Of ATPC In Rain-Dominated Bands Has Not Resulted In ACoordination Advantage – Peak Tx Pwr Is Assumed For Coordinated Tx Pwr
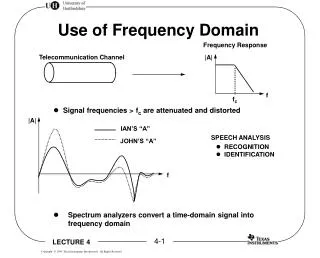
Typical ATPC Operation Fade Required For Tx Pwr To Exceed Nominal Fade Depth At P1 Rx Tx Pwr At P0 Tx Pwr P0 Max dB, dBm - Relative Trigger Level RSL At P1 Rx The ATPC Nominal Tx Pwr Is The Level Until The ATPC Trigger Level Is Reached; Once The Trigger Level Is Reached, Tx Pwr Is Increased, Usually dB-for-dB As The Fade Increases; The Nominal Tx Pwr Is Typically 10 dB Or More Below The Maximum Tx Pwr
ATPC In Rain-Dominated Frequency BandsThree Path Fading Problem 1 0 P – ATPC Equipped Path D – Desired Path I – Interfering Path P0>D0 P D I 1 0 • At Normal P0 TX LVL, Assume Standard Interference Criteria Are Met At D0 • During Rain, When P Fades Above Some ATPC Threshold P0 Tx Pwr Is Elevated; As Fading Continues To Increase, A Maximum Tx Pwr (P0-MAX) Will Be Reached • The D0 RX May Experience Interference Above Criteria If The Rain Fade Loss On Path-I Is Not Sufficient To Overcome The Increase In P0 Tx Pwr • The D0 RX May Or May Not Be Degraded By The Interference, Depending On Fade Depths On Path- I And Simultaneous Fade Depth On Path D; Fading On All Three Paths Is Of Interest
ATPC In Rain-Dominated Frequency Bands Which Path Dn Is Most Likely In Deep Fade When P0 At Tx Pwr Max ? 0 D1 1 P D2 P – ATPC Equipped Path D – Desired Path I – Interfering Path P0>D0 D3 I 1 0 Correlations Could Be Estimated Using Rain Cell Modeling, But The Single Cell Modeling Method Has Weaknesses …
ATPC In Rain-Dominated Frequency Bands 0 D1 1 P P – ATPC Equipped Path D – Desired Path I – Interfering Path P0>D0 D2 D3 I 1 0 • Complications: • For Larger Areas, Single Rain Cell Modeling May Not Be Valid, But Multi-Cell Impractical • With 3 Paths (Distances, Angles) To Model, A Case-By-Case Analysis May Be Required
An Initial ApproachFocus On Only Two (P,I) Of The Three (P,I,D) PathsAnalyze Correlated Fading On Path P & Path I 0 D1 1 P P – ATPC Equipped Path D – Desired Path I – Interfering Path P0>D0 D2 D3 I 1 0 • In Many Cases, When The Fade Depth On Path I Is Sufficient To Cause The Tx Pwr To Increase Above Nominal Tx Pwr, The Loss On Path I Will Be Enough To Offset The Pwr Increase - Then No Increase In Interference To D-Paths • Can A 2-Path Analysis Be Used To Simplify The Problem, Allowing Use Of The Single Rain Cell Model ?
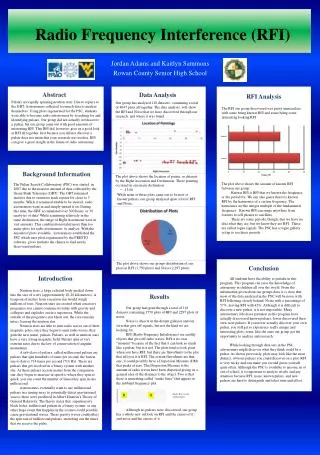
At What Distance, Along A Given I-Path Radial, Will The Rain Loss Most Often Exceed The Increase In ATPC Tx Pwr That Results From A Given Fade Depth On Path P ? Ds-km 1 Specific Example: When Path P (2.0 km, 23 GHz) Reaches A Fade Depth Of 25 dB, ATPC Increases Tx Pwr At P0 By 10 dB Above Nominal – The Maximum. At What Distance Ds-km Is The Fade On Path I>10 dB For All But 0.001% Of The Time When Path P Has Faded For 25 dB or More? Path P 2.0 km 23 GHz H-Pol P I 1 P – ATPC Equipped Path I – Interfering Path P0>D0 0 • Appropriate Criteria For Justifying The Use Of A Coordinated Tx Pwr Less Than Peak Tx Pwr In Rain-Dominated Bands Must Be Discussed Further & Could Be Controversial • While Criteria Is “TBD”, Investigation Of A Calculation Methodology Seems To Be A Logical First Step 9
At What Distance, Along A Given Path I Radial, Will The Rain Loss On Path I Exceed 10 dB For All But 0.001% Of The Time When Path P Has Faded 25 dB Or More ? Ds-km 1 Expectations: For Small Angle Between Path P & Path I, 1st Order Est = (10/25) x 2 km = 0.8 km But, With 0.001% Factor Added , A Path I Longer Than 0.8 km Will Be Required As The Angle Increases, Less Correlation Between Paths I & P – Thus Required Path I Distance Will Increase Path P 2.0 km 23 GHz H-Pol P I 1 0 P – ATPC Equipped Path I – Interfering Path P0>D0 • A More Complete Analysis Would Include Estimating Percentages (%) Of Time The Loss On Path I Is Less Than From 1 dB, 2dB … 10 dB; For Simplicity And Discussion Purposes, Only The 10 dB Percentage Is Analyzed 10
Background And Assumptions • The Rain Cell Model Methodology (Based On Capsoni, et al) Is The Same As Used In Previous NSMA Presentations, Including The “Path Diversity” Topic In 2003; See Addendum • All Rain Cell Simulation Results Are Based On The “Zone N” (95 mm/hr @0.01%, 180 mm/hr @0.001%) Statistics • As A Conservative Factor For Interference Calculation, A Subset Of Cells Are Randomly “Split” Along The Major Axis (50% Of Cells With Peak Rate > 50 mm/hr And Axial Ratio Less Than Median) • All Loss Calculations Assume 23 GHz, H-Polarization • All Calculations Are Believed To Be “Accurate”, But Examples Results Are Displayed For Discussion Purposes -- Not Conclusions
Rain Rate Simulation - Random Factors Follow Model StatisticsFade Correlation Statistics Are Accumulated As Simulation Runs Generate random rain cells, following rain zone statistics, within Simulation Radius Simulation Radius Path P Path I Random Cells Factors: Peak Rain Rate - Rm Cell Radius - rho Location of Cell Center Axial Ratio Major Axis Tilt Angle Cell Split Criteria Virtual Rain Gauges Simulation should reproduce the point rain rate statistics assumed
Example: Two-Path Fading Time MatrixPath P = 2.0 km Path I = 1.07 km, Angle P&I = 30 Degrees Path I Fade Increments – In dB F>10.0 dB 0 1 2 3 4 … 10 Sum Of TimesBeyond 10 dB Line = 0.022% 0 1 2 3 4 … 25 Path P Fade Increments – In dB In this Area, Sum Of Times = 0.001% F-P > 25.0 & F-I < 10.0 In this Area, Sum Of Times = 0.0083% F-P > 25.0 & F-I >= 10.0 F>25.0 dB Sum Of TimesBelow 25 dB Line = 0.0093%
Can A Contour Be Defined, Such That Outside The Contour, A Coordination Advantage Can Be Claimed? D1 P D2 I1 I2 P – ATPC Equipped Path D – Desired Path I – Interfering Path P0>D0 • For Suitable Criteria, Interfering Path I1 Falls Outside The Contour, Thus A Coordination Advantage (Perhaps) Could Be Claimed – That Is, A Coordinated Power Less Than The Peak Tx Power Could Be Used For Interference Analysis Into Path D1 • Interfering Path I2 Falls Inside The Contour, Thus No Coordination Advantage (Or At Least, A Reduced Advantage) Could Be Claimed 15
Is The “<10 dB Fade @ 0.001%” Criteria Conservative ? D1 D2 1 P – ATPC Equipped Path D – Desired Path I – Interfering Path P0>D0 P 0 0 I 0 • Path D2 Is Much Less Likely Than Path D1 To Be In A Deep Fade When ATPC Elevates Tx Pwr At P0; Elevated Interfering Level Is Unwelcome At D1, Even For 0.001%, Due To Correlation Of Fades On Path P And Path D1 • Possible Solutions: Add A “Margin” To The 10 dB Factor, Or Limit Coordination Advantage To <10 dB, Identify “Exclusion Zone”, … • Example: Add “Margin” Of 6 dB, Contour Becomes “<16 dB Fade @0.001%”, i.e. The Path I Fade More Than Offsets The 10 dB Tx Pwr Increase Above Coord. 22
Possible Criteria For Obtaining A Coordination Advantage By Using ATPC In Rain-Dominated Bands (Assuming Path I Critical Contour Method Is Viable) Due To Correlation Between Path P and Path D Fading, Criteria Must Be Conservative; Numbers Below Are For Discussion Only, Not A Rec. • For Rain-Dominated Bands, Possible Criteria: • Time Above Coordinated Tx Pwr = 0.02% Maximum • Fade Before Tx Pwr Increased = 15 dB Minimum Above Coordinated Power • Maximum Coordination Advantage = 10 dB • Margin Added To Coord Advantage = 6 dB • Path I Critical Loss Time Specification = 0.001% (Critical Loss = Coordination Advantage +Margin = 16 dB) Much More Thought On Appropriate Criteria Is Needed
Final Comments • Rain Cell Modeling Seems To Have Promise As A Tool To Investigate Using ATPC In Rain Outage Dominated Bands For A Coordination Advantage • The “Two-Path” (P,I) Approach Simplifies The Problem, A Necessary Requirement For Any Method Used In The Coordination Process • Initially, Case-By-Case Analysis (Unlike ATPC Coordination In Low Frequency Bands) May Be Required • Families Of Curves (Path P Length, P-I Angle, Contour Distance) Could Be Generated For Each Rain Zone Using Rain Cell Modeling, With Interpolation Used To Fit Actual Cases Being Analyzed • Appropriate, Conservative Criteria Should Be Agreed To Before Work On Methodology Proceeds • Because Of Inherent Correlation Of Fades During Significant Rain Events, Elevated Interference Levels (Above “Coordinated”) At Victim Sites Must Be Rare For Acceptance
Final Comments(Continued) • Consideration Of Actual Point-to-Point Antenna Patterns Should Provide Insight To Significance And Usefulness Of The Contour Method Discussed • The Contour Method Could Potentially Be Used To “Clear” Other Interference Cases, Even When ATPC Is Not Involved • NSMA Could Provide A Forum For Discussion Of Need, Practicality, Criteria, Methodology And Process Of Using ATPC For Coordination Advantage – Not An Easy Assignment • Discussion …
Addendum • Selected Slides On Capsoni Rain Cell Model (From NSMA 2003 Presentation) • Additional Data Slides For P=1.5 km, P=2.5 km
Rain Cell Modeling OverviewBased on Capsoni ModelRadio Science Volume 22, Number 3, Pages 387-404, May-June 1987 • A “Rain Cell” is defined as connected region where the rain intensity (mm/hr) exceeds a given threshold • Rain cells have intensity and spatial characteristics which have been statistically modeled based on experimental data collected using meteorological radar • In the Capsoni Model, an elliptical rain cell is specified by: • Peak rain rate (mm/hr) - Rm - at cell center • Characteristic radius at which intensity falls by “1/e” of Rm • Elliptical cell axial ratio = Minor Axis/Major Axis • Orientation of ellipse (“tilt”) w.r.t. coordinate system • The Capsoni Model specifies a cell “1/e radius” statistical distributionfor an assumed cell peak rain rate; on average, higher peak rate rain cells have smaller “1/e radii”
Rain Cell Modeling OverviewBased on Capsoni ModelRadio Science Volume 22, Number 3, Pages 387-404, May-June 1987 • Intuitively, rain cell statistical characteristics are related to the point rain rate cumulative time distributions specified by the Crane and ITU rain zone classification systems • Capsoni, et al, describe a methodology to convert the point rainfall rate rate time distribution data to the statistical factors necessary to complete a rain cell model which can reproduce the assumed point rainfall rate statistics • This model can be used to evaluate the rain fade correlation effects on example desired/interfering path geometries, as well as the “path diversity” effects to be discussed
Elliptical Rain Cell Model Geometry Cell Defined by Rm (Peak Rain Rate mm/hr) and rho_x, rho_y Minor Axis (0.0, rho_y) (1/e * Rm) Rain Rate Isopleth (rho_x, 0.0) Major Axis R = Rm * exp (-sqrt( xf*xf + yf*yf)) where: xf = x/rho_x and yf = y/rho_y By definition, at (rho_x,0.0), R = 1/e * Rm at (0.0,rho_y), R = 1/e * Rm Intensity falls off to infinity Cell Axial Ratio = Minor Axis/Major Axis (on any rain rate isopleth) = rho_y/rho_x< 1.0
Rain Cell Ellipse Major Axis “Split Geometry” Illustration Proposed Modification To Account For Cell Asymmetry For Interference Analysis And Path Diversity ProblemsModel Ellipse Extends to Infinity on One Side of Major Axis y2 100 mm/hr Isopleth y1 x2 Major Axis x1 Assume only one portion of the split rain cell is “active” If rain at origin, also at x1 and y1 If NO rain at origin, rain at x2 and y2 Origin As drawn, Minor/Major Axis Ratio = ~ 0.5