1 / 1

* Estimate is statistically different from estimate for the previous year shown (p<.05).

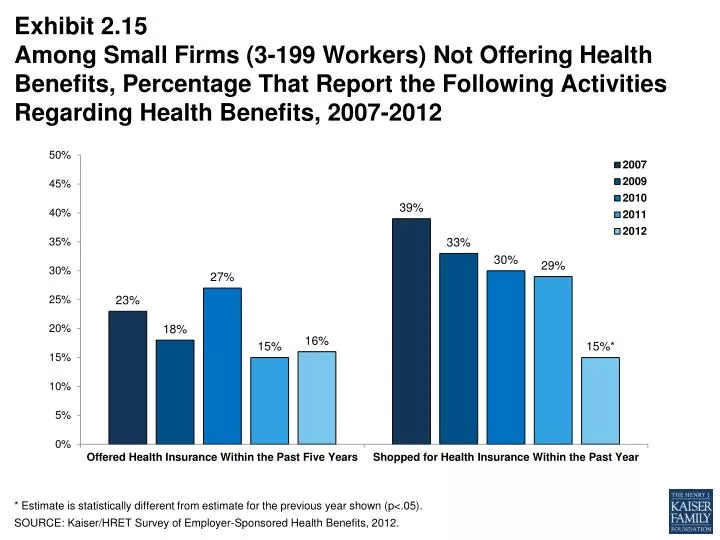
Exhibit 2.15 Among Small Firms (3-199 Workers) Not Offering Health Benefits, Percentage That Report the Following Activities Regarding Health Benefits, 2007-2012. * Estimate is statistically different from estimate for the previous year shown (p<.05).

tam
Télécharger la présentation

* Estimate is statistically different from estimate for the previous year shown (p<.05).

An Image/Link below is provided (as is) to download presentation Download Policy: Content on the Website is provided to you AS IS for your information and personal use and may not be sold / licensed / shared on other websites without getting consent from its author. Content is provided to you AS IS for your information and personal use only. Download presentation by click this link. While downloading, if for some reason you are not able to download a presentation, the publisher may have deleted the file from their server. During download, if you can't get a presentation, the file might be deleted by the publisher.

E N D

Presentation Transcript


  1. Exhibit 2.15Among Small Firms (3-199 Workers) Not Offering Health Benefits, Percentage That Report the Following Activities Regarding Health Benefits, 2007-2012 * Estimate is statistically different from estimate for the previous year shown (p<.05). SOURCE: Kaiser/HRET Survey of Employer-Sponsored Health Benefits, 2012.

More Related