Download
1 / 34
340 likes | 491 Vues
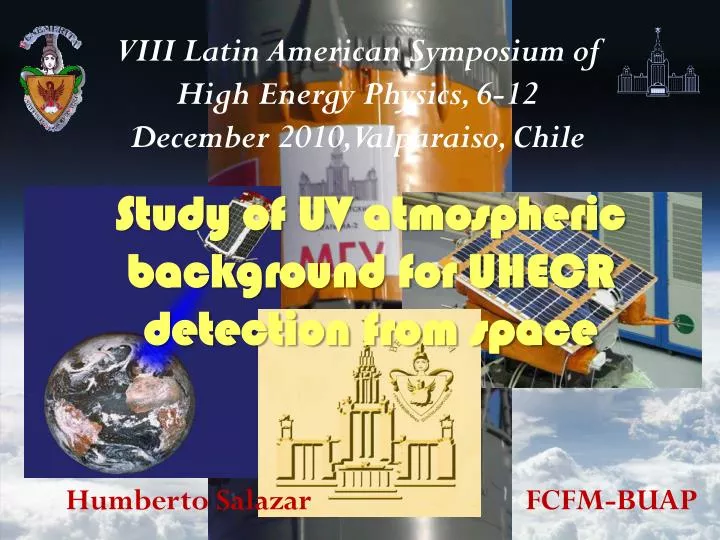
VIII Latin American Symposium of High Energy Physics, 6-12 December 2010, Valparaiso, Chile. Study of UV atmospheric background for UHECR detection from space. Humberto Salazar. FCFM-BUAP. OUTLINE Motivation Satellites for the study of UHECR

E N D
VIII Latin American Symposium of High Energy Physics, 6-12 December 2010, Valparaiso, Chile Study of UV atmospheric background for UHECR detection from space Humberto Salazar FCFM-BUAP
OUTLINE • Motivation • Satellitesforthestudy of UHECR • TheTatyana I satellite (and itsresults) forstudy of atmospheric background for UHECR detection from space • TheTatyana II Satellite and preliminaryresults • Conclusions • Plans for the future
The Auger Sky above 60 EeV 58 events now (with Swift-BAT AGN density map) 27 events as of November 2007 Simulated data sets based on isotropy (I) and Swift-BAT model (II) compared to data (black line/point). Log(Likelihood)
Shower Depths of Maximum Xmax Anisotropy Anisotropy These suggest high cross section and high multiplicity at high energy. Heavy nuclei? Or protons interacting differently than expected? Information lacking for the (anisotropic) trans-GZK energy regime! (Crucial for calculation of the diffuse cosmogenic neutrino flux)
Far greater exposure is needed to • Identify the class of sources via anisotropy • Measure the spectra of bright sources or source regions • Determine the particle type(s) above 55 EeV • If protons, measure interaction properties above 250 TeV (CM) • Determine the diffuse cosmogenic intensity of neutrinos and photons • Detect cosmogenic neutrinos and photons
Proposals todetect UHECR fromuvemissions AleksandrChudakov (mentioned in 1955, published in 1962,simulteneously with Suga,1962) proposed the idea of measurements of atmospheric scintillation(300-450nm) from Cosmic Rays John Linsley’s (1980) idea: to measure ultraviolet emissions from space(AIRWATCH project)
Thebasic idea for UHECR detectionistheflourescenceemissionfrom N2 and cherenkovradiation at end of itstrajectory. Itisnecessarytoanalyzepreviouslythe UV radiationcomingfromtheearth!
Tatyana I satellite UV detector on board the “Tatyana” satellite measured the atmosphere glow in near UV range (wavelengths 300-400 nm). Polar orbit, height-950 km. Measurements were done in period January 2005-March 2007 UV flashes measured by the “Tatyana” detector. Oscilloscope trace- 64 ms. UV energy in the atmosphere 0.1-1MJ
Transient Luminous Events (TLE’s) • Types of TLE’s
TransientLuminousEvents are short lived, fromfewmillisecondstotens of milliseconds 30milliseconds
Transient Luminous Events (TLE’s) Human activity Electrical discharges These events seem to be related to electrical discharges in the atmosphere, also they influence the parameters of the upper atmosphere which could be important for the human activity
Aurora Charged particles collide with the atmosphere molecules and atoms, excite them and resulting optical radiation is observed as “aurora”
TLE’s accordingly by “Tatiana I” In 2 years of observation the UV transient events do not correlate with continents as it is the case for lightning (!).
At moon nights the UV intensity varies mostly due to “albedo” effect of clouds. Correlation of UV intensity with clouds along the satellite route is easily observed.
Iuv ~109 ph/cm2 s sr Iuv ~108 ph/cm2 s sr). ThemainresultbyTatyana I indicatesthere are tworegions of UV intensity: the polar zone (aurora) and the ecuatorial zone.
“Tatyana-II” scientific payload(launched on September 17, 2009 orbit , 830 km height and 98.8˚ inclination) “Digital oscilloscope” time sample 1 ms, acquisition time 128 ms. Energy threshold of charged particles 1 MeV The brightest event in 1 minute is finally recorded. Detector apertures were almost the same: field of view 14º (Tatiana-1) and 16º (Tatiana-2) with diameter of the atmosphere in FOV ~250 km UV detector (300- 400 nm) and Red-IR radiation (600-800 nm). Electron flux detector with 400 cm2 effective area
Preliminary results by Tatyana II Satellite
Tatiana-II night atmosphere UV radiation monitoring data At moonless nights the darkest places on Earth in UV light are Sahara desert, Siberia, Southern regions of Pacific and Atlantic oceans (UV intensity 3-5 107 ph/cm2 s sr).
Night cities lights The brightest are the aurora regions (UV intensity up to 2 109 ph/cm2 s sr – “Tatiana-1” data) and regions above large cities or industrial regions (up to 1-2 108 ph/cm2 s sr). Those data are important for planning the Cosmic Ray measurements from Satellites.
World map of UV flashes events by Tatyana II Results of measurements in Tatiana-2 mission with a new trigger for flashes: “selection of the brightest flash in period of 1 minute” confirm the latitude effect but changed the event rate ratio above ocean and continents. The new global distribution of UV flashes does not contradict the global lightning distribution.
World map of RED - IR flashes events by Tatyana II Most energetic events were observed above land (maybe they could be ELVES)
New data on the ratio of UV and Red radiation. Up till now we did not find any difference in global distribution of flashes with different UV/Red ratio . Blue points are flashes with ratio UV/Red more than average. Red points are flashes with ratio UV/Red less than average.
Serials of flashes UV-R-IR detector frequently measured serials of flashes along the night orbit . Number of flashes (N) in serial varied from 3 to 11 (one flash per minute). In 1 months 56 serials were recorded. Most of serials were observed above land. Flashes in one serial are of various types
Serials of flashes and the geomagnetic equator. Part of serials is symmetrical to equator and could be related to electrons trapped by geomagnetic field. The Southern Hemisphere latitudes >30o are at the day side. Sahara is evidently region restricted to flash events.
Serials of flashes and clouds. Red dots: TLE’s, Blue dots: lightning Many flashes occurs above clouds and can be related to thunderstorms, but frequently there are no clouds under measured flashes. Pictures above show two such event examples. Further statistical analysis of all events will be done.
ROSAT DANISH OERSTED SATELLITE Electrons : 50 keV - 1 MeVProtons : 250 keV -30 MeV Alfa particles: 1-100 MeV TATYANA II Electrons:0.1-10.0 MeV UV energy-0.5 KJ • CP detector is designed for measurements of msec pulses. It is not sensitive to average low flux of charged particles. On the world map, obtained by “Tatiana-2” satellite only the particle flux at South Atlantic Anomaly is clearly seen (> 102 el/cm2 s). • In aurora regions the particle flux is near detector sensitivity threshold. • There is no signals of charged particles synchronous to UV flashes.
South Atlantic Anomaly zone withhighamount of chargedparticles The detector worksproperly!
Conclusions • The detailed map of UV average intensity is obtained by “Tatyana-II” data. This map is important for planning orbital high energy cosmic rays measurements. • Map of charge particles signal was also obtained. Measurements of CP flux in SAA have shown that charge particle detector works properly. The CP signal synchronous to UV flashes was not detected . • Measured flashes have various temporal profiles. Two types of flashes: 1) events with clear structure of short (1-3 ms) pulses and events with longer structure are separated as different in energy release to UV photons and different in world distribution. • The serials of flashes are measured with number of flashes within one serial (number of flashes in one serial: from 3 to 11). Serial contain flashes of various types and occur more frequently above land. • There are flashes not connected with lightning (no clouds under the flash). The origin of those flashes is under analysis. • DATA ANALYSIS IS IN PROGRESS
As the next step in the analysis we plan: • To provide the analysis of event-to-event correlation of flashes and lightning with the help of data from world wide radio- network. • To make detailed analysis of UV/Red ratio as for various classes of flashes so in the individual flashes. • To relate TLE’s origen with other phenomena. • To get a better classification of the TLE’s according data Lomonosov satellite.(to be launched, 2012)
MSU Space Project «Mikhailo Lomonosov» Scientific objectives Studies of transient phenomena in the Earth's upper atmosphere Generation mechanisms? Location in the atmosphere? Observation of ultra-high energy cosmic rays
MSU Space Project «Mikhailo Lomonosov» UCLA University of California