Download
1 / 55
570 likes | 771 Vues
Chapter 24: Macro-Level Valuation II: REITs. REIT Market Capitalization…. Represents over $250 billion in property assets. ≈ 10% - 20% of all “institutional scale” commercial R.E. assets in U.S. (depending on definition).

E N D
Chapter 24: Macro-Level Valuation II: REITs
REIT Market Capitalization… • Represents over $250 billion in property assets. • ≈ 10% - 20% of all “institutional scale” commercial R.E. assets in U.S. (depending on definition). • Typically 5% - 10% of REIT assets are construction in progress (devlpt), vs 2% - 3% of U.S. commercial property as a whole (REITs are mostly investors, but non-trivial developers too).
e.g., Green Street Cohen-Steers Vanguard Etc… Yield-oriented Value-oriented Small-Mid cap REIT Investors… Recall: Different types of investors have different objectives, constraints, concerns, horizons, income-vs-growth preferences, risk preferences, etc…
Property-Level Valuation Most Important (Ch.23) Entity-Level Valuation Most Important (Ch.24) Static Portfolios, Indices REITs Funds Unit Trusts LPs REOCs “Macro-level valuation” Valuation of aggregates of numerous individual properties, e.g., portfolios, indices, funds, REITs… The spectrum of macro-level R.E. equity investment entities: • Valuation issue: • Static portfolios (private assets) Value estimation (measurement). • REITs (publicly-traded assets) Value determination (causal).
Like typical industrial/service/information companies traded on the stock exchanges, except: • Exempt from corporate income tax • Restricted to real estate investment related activities • Restrictions on “merchant building” • Must pay out 90% of earnings in dividends • So REITs are “different animals” – somewhat passive (compared to other stocks), “pure plays” (in real estate). • Nevertheless . . .
24.1 REIT Valuation in the Stock Market Stock market is highly integrated. REIT equity shares are traded in the stock market. So REITs are valued essentially like other stocks (DCF, Ch.10): DIV = Annual entity (firm) level equity cash flow to stockholders (“Dividends”). Roughly: DIV EBTCF (Ch.14) from current properties (inclu reversion) = PBTCF – DS. r = Stock Mkt’s required ex antetotal return to firm-level equity (REIT’s avg equity cost of capital). E = Value of REIT’s equity (stock price). More common short-cut is: 24.1.1 Gordon Growth Model (GGM): (Based on forward-looking long-run average r and g.) g = Long-run avg future growth rate in dividends.
GGM REIT Value = f ( DIV1, g , r ). Based on three values . . . • DIV1 EBTCF = PBTCF – DS (holdings & sales): • Analyze firm’s current property operations & financing. • Firm can temporarily pay out more cash than it earns from operations by the use of sales of its assets or by the use of financing techniques, but GGM requires long-run average values (avoid or stabilize “extraordinary” sources of dividends). • g is very important ( 1 pt Δg ≈ 10% ΔE ). Reflects: • LR growth in EBTCF (sustainable“same store growth” + “plowback”). • LR ability of REIT mgt to generate “growth opportunities” (NPV>0 projects). r = Firm’s avg equity OCC = rf+ RP = y + g , in the firm’s equity: Based on Stock Mkt’s perception & evaluation of firm-level risk. Two major traditional approaches to estimate E[RP]: CAPM & GGM. (Best applied to a class or type of stocks.) Most volatility in REIT prices due to changes in mkt expectns about g & r.
Analysis Tip: The GGM can be applied either to dividends or to earnings: • The firm’s equity OCC ( r ) is the same*, but you have to be careful about the relevant growth rate in the denominator: • g = Long-run growth rate in dividends per share. • gE = Long-run growth rate in pre-existing assets’ earnings per share (for REITs, usually growth rate in levered “same store” earnings, over the long run). • Note: gE = g – pyE , where p = Payout Ratio (fraction of earnings paid out as dividends: • p = 1 – (DIV / EPS) ). • DIV1 = (1-p)EPS1 = (1-p)yEV0, where: • yE = equity income yield from the firm’s underlying asset equity (≈ EBTCF/E, or FAD/E), • V0 = firm’s underlying asset equity value per share at the beginning of Year 1. Then: • DIV2 = (1-p)yE[(1+gE)V0 + pyEV0] = (1-p)yE(1+gE+pyE)V0 = (1+gE+pyE)DIV1 . • g = gE + pyE , gE = g – pyE . Note:In this model V0is essentially the same as E, the firm’s current value of equity. For a REIT, in the absence of growth opportunities (all acquisitions @ NPV=0), E and V0are essentially based only on the firm’s assets in place, and yEis the current equity yield of those assets. Thus, gEis essentially the long-run growth rate in“same store”earnings (as levered). Reality Check: In long run (in absence of NPV>0 growth opportunities): High Price/Earnings Ratio Either low r, or high same-store levered gE . How sustainable is a low r?; How realistic is a high same-store levered gE?
Recall… • g is very important ( 1 pt Δg ≈ 10% ΔE ). Reflects: • LR growth in EBTCF (sustainable“same store growth” + “plowback”). • LR ability of REIT mgt to generate “growth opportunities” (NPV>0 projects). • Same store growth (existing property cash flow growth) is pretty mundane: • Easy to quantify, Easy to predict, • Usually not very exciting (R.E. “bricks & mortar” are “cash cows”, not “growth stars”, though use of leverage can make more exciting). • Plowback (NPV=0 acquisition of assets) is more uncertain: • How long can firm find new acquisitions at NPV=0? • But analyst can “short-cut” around this question by using EPS version of GGM. • Growth opportunities (NPV>0 actions) is the more interesting source of g : • More uncertain & difficult to predict (how realistic?, How sustainable?), • More volatility in mkt expectns about magnitude of NPV>0 opportunities. Growth opportunities: Micro-level:Buy Low or Sell High Deals; “Arbitrage” betw publ & priv mkts; Entrepreneurial/Innovative Devlopment; Creative Mgt of Operations. Macro (firm) level:Economies of Scale; Franchise Value; Rental Mkt Dominance; etc.
24.1.2 Fundamental Growth Opportunities Are REITs growth stocks or income stocks?… Beneficial of Boston (BOB): An “income REIT”… Owns properties that pay $100 million / yr, in perpetuity, no debt. OCC = r = 10%; g = 0. Using GGM, BOB’s equity is worth:
Sioux Realty (Sioux): A “growth REIT”… Sioux owns stabilized operating properties like BOB’s that pay $50 million / yr in perpetuity, no debt, plus: Land on which a completed project worth $3000 million in one year can be built, at a cost of $2400 million construction. Due to the risk in this development project (note the operational leverage), the OCC for this project is 20%. Thus, Sioux’s value is:
BOB’s and Sioux’s Price/Earnings multiples are: If they pay out all their income as dividends, what are the current yields of these two REITs? Answer: BOB yield = 10%, Sioux yield = 5%. Why is Sioux a “growth REIT”?… Is it because Sioux “does development projects”?… Suppose Sioux did not already own the land (and were similar to the “second best developer” on the site)?
“Most REITs are not growth stocks most of the time, but some REITs are growth stocks most of the time, and most REITs are growth stocks some of the time.” Last case is possible because of… Growth stocks have positive NPV opportunities. Value of Firm = Value of Existing Assets in Place (less debt) + Net Value of Growth Opportunities = • Typical sources of growth (NPV > 0) opportunities in REITs (if any): • Developable land already owned. • Entrepreneurial abilities (in devlpt, or possibly other activities). • Macro-level abilities (scale economies?, franchise value?, econ of scope?). • Differential property asset valuation in stock vs private property markets.
24.1.4 Parallel Asset Markets Stock Mkt & Private Property Mkt do not always agree on the value of commercial property as an investment. Compare REIT stock price to property NAV (net asset value)…
What is REIT “NAV” ? . . . • Net Asset Value = REIT Assets Value (as valued in property market *) • – REIT Liabilities** • ÷ No. Shares Outstanding • * As estimated by REIT analyst, e.g.: “mass appraisal”: • Divide REIT holdings into major market segments (e.g., Offices in Boston, Warehouses in Chicago); • Identify NOI (like EBITDA) associated with each segment; • Estimate current property mkt prevailing “cap rates” in each segment; • Apply estimated cap rates to estimated NOI to estimate asset value in each segment. • Add and adjust for: (i) Land holdings & construction in progress; (ii) Non-asset-based earnings (e.g., prop.mgt fees) using estimated P/E ratio. • ** Theoretically should be market value of debt (often book value used in practice). • Comparison of resulting NAV with the stock mkt based share price: • Stock Mkt / Property Mkt Valuation Differential, Stock Value – NAV = NPV of REIT Growth Opportunities (as valued by the stock mkt); &/or… • Errors or omissions in the NAV estimation process.
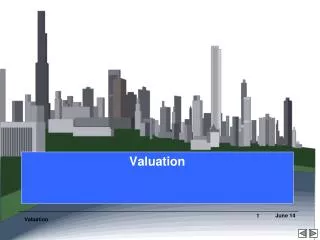
Another perspective on this same point… Source: Authors’ estimates based on NAREIT Index and NCREIF Index. (NCREIF cash flows are based on NOI, NAREIT cash flows are based on dividends paid out.)
The exhibit displays the NAREIT share price level index and NCREIF appreciation level index, both de-trended and normalized to have average value of zero and standard deviation of one.
The point is . . . • REIT-based valuations & private property mkt-based valuations appear to be different much of the time. • These differences do not appear to be explainable by differences in the underlying operating cash flows of the REITs vs the private properties; nor are they explainable entirely by purely firm-level considerations (e.g., debt financing, entity-level mgt, trading, etc.). • Thus, at least part of these differences appear to be micro-levelvaluation differences, differences in the two markets’ perceptions of the values of the same underlying properties as of the same point in time (“micro-level” = “bricks & mortar”, underlying assets as opposed to firm-level effects). • There is some evidence that REIT valuations tend to be a bit more volatile, and to lead the private property market valuations in time (based on timing of major cyclical turning points, the lead may be up to 3 years.)
Major investment issues of the valuation difference: • Which market should the investor use to make real estate investments: public (REIT), or private (direct property)? • Is there scope for “arbitrage” between the two markets? That is, can (nearly) riskless profits be earned by moving assets from one ownership form to the other: • Taking private assets public via REIT acquisition or IPO?; • Taking REIT assets private via buyout/privatization or simply via sale of assets or secured debt in the private market)? • What is the nature and magnitude of the micro-level differential valuation (and which value is “correct”)?
From Chapter 12 (Section 12.3)… Definition of the micro-level valuation difference: For specific individual properties: IVREIT≠ MVPRIV (Recall that stock mkt makes: IVREIT=MVREIT in share price. Thus, if a micro-level valuation difference exists, then profitable (NPV > 0) opportunities exist for REITs by buying or selling properties in the private property market. This is often referred to as (positive or negative) “accretion” opportunity for REITs: REIT Buying: NPVMV(REIT) = NPVIV(REIT) = IVREIT – MVPRIV REIT Selling: NPVMV(REIT) = NPVIV(REIT) = MVPRIV – IVREIT Mitigated by transaction costs and management or firm-level considerations.
When REIT valuation > Private valuation (positive REIT premium to NAV): • REITs have growth opportunities (NPV>0, “accretion”) from buying in the private market. • REITs raise capital by issuing stock in the public mkt, use proceeds to buy properties. • When REIT valuation < Private valuation (negative REIT premium to NAV): • REITs are no longer “growth stocks”, and their shares are re-priced accordingly in the stock market (price/earnings multiples fall, REITs are priced like “value stocks”, or “income stocks”). • In the extreme, REITs may become “shrinking stocks”, maximizing shareholder value by selling off property equity (or debt) and paying out proceeds in dividends. • The 2 mkts swing between these 2 conditions, also with periods when they are nearly equal valued. • Little “arbitrage trading” occurs when the 2 mkts are within 5%-10% of each other’s valuations (due to transaction costs, firm-level effects). • Arbitrage trading tends to keep valuation differences to less than 15%-20%, but occasionally greater differences have briefly occurred.
How can a REIT “remain a REIT in business”, and still maximize shareholder value during times when the stock market valuation of real estate is less than the private property market valuation? . . . IVREIT < MVPRIV • Sell into the private market most but not all of the equity in many of their properties (e.g., sell properties into a partnership controlled by the REIT, with passive equity partners), paying out proceeds in extraordinary dividends (or stock purchases), while retaining effective operational control over the assets (e.g., sell to passive partners, such as pension funds): REIT retains scale & operational product. • Issue secured debt (mortgages) collateralized by the excess of MVPRIV over IVREIT , paying out proceeds as extraordinary dividends. • Sell some of their properties outright into the private market (paying proceeds as dividends or stock purchase), but subject to contracts to retain the REIT as property manager. • If private market valuations are sufficiently high (and expected to remain so), consider going into development projects with most financing coming from external private equity and debt sources: Use the REIT’s entrepreneurial capability; Use developable land already owned; Maximize leverage of private market valuation. (Note: Though tempting, this strategy is risky at the peak of a private market cycle.) • Reinvest proceeds from domestic private market sales into international real estate assets where valuations are lower (yields are higher).
Causes of micro-level valuation differential: Two possible sources: CFs & OCC (Recall DCF valuation formula.) • The CF-based source: Idiosyncratic valuation differences: • Affects specific properties or specific REITs. • Caused by differential ability to generate firm-level incremental CF from same properties (e.g., REIT scale economies, franchise value, space market monopoly power, etc.) • The OCC-based source: Market-wide valuation differences: • Affects all properties, all REITs. • Reflects different informational efficiency (REIT lead). • Reflects different investor clienteles and different market functioning leading to different liquidity, different risk & return patterns in the investment results, causing differential perceptions or pricing of risk. Note: Some REIT mgt actions, such as capital structure (financing of the REIT), property devlpt or trading strategy, etc., affect firm-level REIT value but not micro-level property valuation (of existing assets in place).
Which valuation is “correct”? . . . Would you believe… They both are? (Each in their own way, for their relevant investor clientele.) • But keep in mind… • Tendency of REIT market to lead private mkt (sometimes up to 3 years). • Tendency of REIT market to exhibit “excess volatility”: • (transient “overshooting” of valuation changes, followed by “corrections”. • Two markets sometimes exhibit a “tortoise & hare” relationship.
It is worth reviewing Section 12.3.5 at this point… 12.3.5: Risk is in the objectnot in the beholder. (Remember from Ch.10: Match disc.rate to the risk of the investment whose CFs are being discounted.) Property "X" has the same risk for Investor "A" as for Investor "B". Therefore, oppty cost of cap (r) is same for “A” & “B” for purposes of evaluating NPV of investment in “X” (same discount rate). Unless, say, “A” has some unique ability to alter the risk of X’s future CFs. (This is rare: be skeptical of such claims!)
Example... REIT A has expected total return to equity = 12%, Avg.debt int.rate = 7%, Debt/Total Asset Value Ratio = 20%What is REIT A’s (firm-level) Cost of Capital (WACC)? Ans: (0.2)7% + (1-0.2)12% = 1.4% + 9.6% = 11%. REIT B has no debt, curr.div.yield = 6%, pays out all its earnings in dividends (share price/earnings multiple = 16.667), avg.div. growth rate = 4%/yr. What is REIT B’s (firm-level) Cost of Capital (WACC)? [Hint: Use “Gordon Growth Model”: r = y + g.] Ans: 6% + 4% = 10%.
Example (cont.)... Property X is a Boston Office Bldg, in a market where such bldgs sell at 8% cap rates (CF / V), with 0.5% expected LR annual growth (in V & CF). It has initial CF = $1,000,000/yr.How much can REIT A afford to pay for Prop.X, without suffering loss in share value, if the REIT market currently has a 10% premium over the private property market in valuation? Answer: $13,750,000, analyzed as follows… Prop.X Val in Priv.Mkt = $12,500,000 = $1,000,000 / 0.08 = $1,000,000 / (8.5% - 0.5%), where y = r – g, as const.growth perpetuity. Prop.X Val in REIT Mkt = $12,500,000 * 1.1 = $13,750,000, due to 10% premium. Note: “cap rate” in REIT Mkt = 1/13.75 = 7.27%, • OCC for REIT is rX = 7.27% + 0.5% = 7.77%, i.e.: $13.75 = $1/(.0777-.05). Note: • Prop.X value for REIT is not equal to: $1,000,000 / (11% - 0.5%) = $9,524,000. • OCC relevant for valuing Prop.X purchase for REIT is not 11% (REIT A’s firm level WACC). • Nor is relevant OCC equal to: Prop.X OCC in Private Mkt = 8% + 0.5% = 8.5%.
Example (cont.)... Same question for REIT B . . . Answer: Same as value for REIT A: Prop.X Val for REIT B = $1,000,000 / (7.77% - 0.5%) = $13,750,000. • This is not equal to $1,000,000 / (10%-4%) = $1,000,000 / 6% = $16,667,000, REIT B’s P/E multiple applied to Prop.X earnings. • Most of REIT B’s assets must be higher risk and higher growth than Prop.X (perhaps REIT B mostly does development projects). How much can Private Consortium “C” afford to pay for Prop.X? Answer: $12,500,000 = $1,000,000 / 0.08 = The Private Mkt’s Value. How much should either REIT (A or B) pay for Prop.X? Answer: $12,500,000, since that is the private mkt MV, unless they have to compete with each other (or other REITs), & the resulting bidding war bids the price up above that.
Example (1 last question...) Suppose REIT B can borrow money at 6% while REIT A must pay 7% for corporate debt. Does this mean REIT B can afford to pay more for Prop.X than REIT A, assuming both REITs would finance the purchase with corporate-level debt?... • Answer: No. • The value of the asset in the firm’s equity is unaffected by it’s corporate cost of debt. • The firm’s borrowing rate does not generally equal either its firm-level WACC or the specific OCC relevant for a given investment.
24.2 REIT Terminology & Analysis Issues • 24.2.1 Tax & Regulatory Constraints • REITs are exempt from corporate income tax: • Original intent of 1960 REIT Act was to create a “mutual fund” type vehicle to allow small investors to invest in commercial real estate. (Mutual funds pay no taxes, but pass through tax obligations to investors on dividends and CG realized in the fund each year.) To implement the spirit of this law, REITs must be: • Passive “pass-through” type vehicles similar to mutual funds; • Confined to “pure plays” in real estate investment; • Required to maintain broadly-dispersed ownership (many investors). • Some of these requirements have been relaxed over the years, but several constraints are currently applied to REITs (and are likely to remain)…
Major REIT constraints required to maintain tax-exempt status: 1) “Five or Fewer Rule”.A REIT cannot be a closely held corporation. No five or fewer individuals (and certain trusts) may own more than 50% of the REIT's stock, and there must be at least 100 different shareholders. 2) “Real Estate Pure Play”.75% or more of the REITs total assets must be real estate, mortgages, cash, or federal government securities, and 75% or more of the REIT’s yearly gross income must be derived directly or indirectly from real property (including mortgages, partnerships and other REITs). 3) “Earnings Payout Requirement”.90% or more of the REIT’s annual taxable income must be distributed to shareholders as dividends each year. (The idea is that the shareholders will then pay ordinary income tax on the earnings in their personal taxes.) 4) “Passive Investment Entity Requirement”.REITs must derive their income from primarily passive sources like rents and mortgage interest, as distinct from short-term trading or sale of property assets. They cannot use their tax status to shield non-real-estate income from corporate taxation. A REIT is subject to a tax of 100% on net income from "prohibited transactions", such as the sale or other disposition of property held primarily for sale in the ordinary course of its trade or business. However, if the REIT sells property it has held for at least 4 years and the aggregate adjusted basis of the property sold does not exceed 10% of the aggregate basis of all assets of the REIT as of the beginning of the year, then no prohibited transaction is deemed to have occurred.
However, there have been some significant relaxations of REIT constraints, most notably: • 1986: REITs permitted to “self manage”, no longer have to hire an external manager. • This permits REITs to be much more “active”, integrated corporations, similar to typical industrial firms (only still subject to the previously-noted constraints). • 1993: REITs permitted to “look through” a pension fund to count it as a number of investors equal to its members (avoids Five or FewerRule for pension fund investment in REITs). • 1999: REITs permitted to engage in non-REIT type activity via Taxable REIT Subsidiaries (TRS), in which the subsidiary is subject to corporate income tax (e.g., 3rd-party property management, brokerage, property trading).
How binding is the 90% payout constraint? . . . • The 90% earnings payout requirement could force REITs to rely more heavily on external sources of capital (e.g., stock mkt, bond mkt, mortgages) than other corporations. • But in fact, this constraint has not usually been binding: • Typical REIT pays out more than the minimum requirement. • This is because: • Real estate is a capital intensive business investing in “cash cows”, not a growth industry demanding constant cash feeding. • IRS depreciation rules allow property assets to be depreciated even though nominal values and cash flow generation typically do not decline, hence, depreciation expenses shelter much cash flow (reducing taxable income, hence reducing the payout requirement). • During the 1990s the then-requirement of 95% earnings payout typically equated to only about 60% of REIT operational cash flow, and the average REIT dividend payout was about 65% of such CF.
Nevertheless, the REIT restrictions (not just the 90% payout rule, but other constraints previously noted as well), do have some limiting effect on REIT operations, • at least for some REITs at some times. • These restrictions may provide some reason, in specific instances, why a REIT’s stock market valuation might be less than the NAV of the property assets it owns. • And to avoid these constraints is the reason why many real estate firms (some publicly-traded) have elected to be “C-corporations” subject to corporate income tax. • Such firms are called “REOCs” (Real Estate Operating Companies). • Obviously, the “merchant building” firms, such as the major publicly-traded tract housing developers, are all REOCs.
24.2.2 REIT Earnings Measures • The Problem: • How to compare REIT earnings with those of other corporations (e.g., so as to compare share price/earnings multiples on an “apples vs apples” basis. • Real estate investment & ownership (the “REIT business”) is very capital intensive: • REITs have abnormally high depreciation expenses, which reduce “official earnings”(GAAP net income), the standard measure of corporate earnings on Wall Street. • Yet REIT assets do not actually depreciate in the sense that “same-store” property cash flows and values typically do not decline in nominal terms (because the real depreciation rate in property is typically matched or even exceeded by the general monetaryinflation rate). • Hence (so the argument goes): GAAP earnings don’t present a “fair” or “accurate” measure of REIT earnings.
In the early 1990s, the REIT industry (through NAREIT) came up with an alternative measure of earnings that the industry tried to promulgate as a substitute for GAAP net income for the REIT industry: “Funds From Operations” FFO • FFO (“Funds From Operations”) • Start with GAAP net income. • Then: • Add back:Real property depreciation expense. • Add back:Preferred stock dividends and distributions to OP unit-holders. • Deduct:Net gains from property sales & extraordinary items.
This was further supplemented by another measure that more closely reflected cash flow actually available for external distribution: “Adjusted Funds From Operations” (AFFO), or “Funds Available for Distribution” (FAD), or “Cash Available for Distribution” (CAD). FAD (“Funds Available for Distribution”, aka AFFO, CAD) Start with FFO. Then: Deduct:Capital improvement expenditures (CI). Deduct:Amortization of debt principle (AMORT). Adjust for:Straight-line rents. Terminology Alert! In common parlance it is often not clear exactly what measure is being referred to when people use the term “FFO”.
FFO is often spoken of as the analogy at the REIT level of the “NOI” at the property level. But what is an important difference between these two measures of earnings?... FFO is a firm-level measure that is net of interest payments on the REIT’s debt. NOI is a property-level measure that is free and clear of debt. AFFO (or FAD) is the firm-level analog to the EBTCF (Equity Before-Tax Cash Flow) measure at the property level. In late 1990s, FAD ≈ 1.3 to 1.8 times GAAP net income for typical REIT. Typical P/E ratios based on AFFO have varied between 8 and 12 in recent years for most REITs, while dividend yields have averaged 6% to 8%. A simple (and somewhat simplistic) method of REIT valuation of a property acquisition would be to compare the property price / EBTCF multiple (based on the REIT’s target capital structure debt applied to the property) with the REIT’s current stock market share price/earnings multiple based on AFFO. If the latter exceeds the former, the acquisition may seem feasible (and/or “accretive” if the REIT multiple exceeds the property multiple). However, you are more sophisticated than this simplistic approach, aren’t you!
Problems with FFO, AFFO, etc.,… The principle underlying “The FFO Movement” is valid: Cash flow matters more than accounting numbers. • However, in practice several problems arose with the use of FFO: • The REIT industry could never agree on a single, mandatory standard definition of how to define and measure FFO (or AFFO, or any of the other cash-oriented earnings measures). • There arose a profusion of different measures and definitions, with each REIT tending to customize its own measure (e.g., REITs that made substantial money from property sales didn’t like FFO’s removal of extraordinary earnings due to asset sales; they said their “operations” included “asset sales”). • There was a substantial loss in credibility (based perhaps more on perception than reality), which was exacerbated with the general corporate “Pro-Forma Earnings Scandal” of the early 2000s, associated with the stock market crash. For all its faults, GAAP net income has the one great advantage that it is uniformly and precisely defined, the same for everyone.
24.2.3 Agency Costs: Conflicts of Interest • Some major issues to watch out for… • 1) Transaction bias in UPREITs: • Due to tax-based conflict (different cost basis for LP investors vs public stock investors)?… • 2) Real estate interests outside the REIT: • Do REIT managers have other real estate interests that compete with the REIT’s properties or for the managers’ time & energy (other properties not in the REIT, other interests such as brokerage or management firms)?… • 3) Potential for “self-dealing”: • Do REIT managers have incentives to have the REIT engage in “Sweatheart” deals with brokerage, management, development firms in which they have interests?… 4) Take-over difficulties re “5-or-Fewer Rule”: • REIT governance often makes hostile takeovers particularly difficult, in part due to 5-or-Fewer Rule.
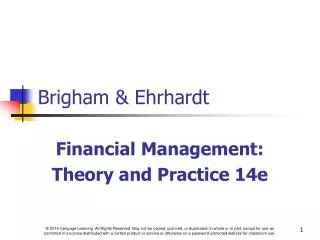
Public Investors (Stockholders) Private Investors (Partnership Unit-holders) REIT Umbrella Partnership (UP) Operating Partnership (OP) Operating Partnership (OP) Operating Partnership (OP) Property Property Property The “UPREIT” Structure
24.3 Some REIT Strategic Management Considerations The traditional real estate cliché about the “3 determinants of value”: “Location, location, location”. The modern REIT cliché about the “3 determinants of value”: “Management, management, management”. Six major strategies or strategic considerations… • 1) Financial strategy: “Caught between a rock and a hard place”… • - REITs don’t have traditional C-corp income tax-based rationale for use of debt financing. But REITs often need external capital (R.E. is capital-intensive, and REITs must pay out 90% of earnings). Various considerations enter the REIT capital structure equation: • Stock market wants growth; • Real estate is not a growth asset without lots of leverage (maximized by short-term or floating-rate debt); • Stock market doesn’t like REITs to be highly levered (especially with short-term or floating-rate debt). • Solution: walk the tightrope carefully.
L S IVA=$101.92=$106/1.04 MV=$100=$106/1.06=$104/1.04 IVC=$99.04=$103/1.04 D Q0 QD* QD Aside:Numerical example (drawn from Ch.15): The Value to a Tax-Exempt Pension Fund of an Investment in Corporate Bonds Market for Taxed Debt Assets: Mkt Int.Rate = 6% • Corp Bond Mkt Int Rate = 6% • Muni (tax-exempt) Mkt Int Rate = 4% • Eff. Tax Rate on Margl Investor in Dbt Mkt = 33%. L = PV of a Loan (Debt Asset) in which Borrower will pay $106 next year. MV = Market Value = $100 = BTCF / (1+BTmktOCC) = $106/1.06 = IV(for margl investors) = ATCF / (1+ATmktOCC) for marginal investors = $104/1.04 = $100. IVA = Investment Value of the Corporate Bond to the Tax-Exempt Pension Fund = ATCF / (1+ATmktOCC) = $106/1.04 = $101.92. IVC = Investment Value of the Corporate Bond to a Double-Taxed Corporation (assuming corp.inc.tax rate = 33%, personal eff.tax rate on equity returns to shareholders = 25%) = ATCF / (1+ATmktOCC) = ($106-(.33)$6-(.25)$4) / 1.04 = $103/1.04 = $99.04. Hence: NPV = IV-MV = -0.96 < 0, Hence, short bonds (i.e., borrow, don’t lend.) Note: The issuance of one more corporate bond displaces alternative investment (or consumption) on the margin within the capital market, whether that bond happens to be sold to an intra-marginal or marginal investor, and whether that bond happens to be issued by an intra-marginal or marginal borrower.
L S IVA=$101.92=$106/1.04 MV=$100=$106/1.06=$104/1.04 IVC=$99.04=$103/1.04 D Q0 QD* QD Answer: Neutral. Aside:Numerical example (drawn from Ch.15): The Value to a Tax-Exempt Pension Fund of an Investment in Corporate Bonds Market for Taxed Debt Assets: Mkt Int.Rate = 6% • Corp Bond Mkt Int Rate = 6% • Muni (tax-exempt) Mkt Int Rate = 4% • Eff. Tax Rate on Margl Investor in Dbt Mkt = 33%. L = PV of a Loan (Debt Asset) in which Borrower will pay $106 next year. MV = Market Value = $100 = BTCF / (1+BTmktOCC) = $106/1.06 = IV(for margl investors) = ATCF / (1+ATmktOCC) for marginal investors = $104/1.04 = $100. IVA = Investment Value of the Corporate Bond to the Tax-Exempt Pension Fund = ATCF / (1+ATmktOCC) = $106/1.04 = $101.92. IVC = Investment Value of the Corporate Bond to a Double-Taxed Corporation (assuming corp.inc.tax rate = 33%, personal eff.tax rate on equity returns to shareholders = 25%) = ATCF / (1+ATmktOCC) = ($106-(.33)$6-(.25)$4) / 1.04 = $103/1.04 = $99.04. Hence: NPV = IV-MV = -0.96 < 0, Hence, short bonds (i.e., borrow, don’t lend.) Where would REITs lie in this model: Tax Advantaged (A), Tax Disadvantaged (B), or Tax Neutral?...
Why use taxed-investor OCC in tax-exempt disc.rate to compute IV for P.F.?... • Marginal corporate shareholder is a taxed individual. • Marginal pension plan member is a taxed individual. • Marginal investment of most individuals is a taxed investment (or else obtains a lower yield, like muni bonds), even though most individuals may also have tax-sheltered investments. • The ability to invest in tax-exempt vehicles that provide before-tax return levels, such as IRA or pension investments, is limited. Such investment is therfore intra-marginal. • Intra-marginal investment displaces other investment (or consumption) on the margin. Hence, this other investment (or consumption) at the margin represents the opportunity cost (what is foregone or given up) caused by the subject investment. Even if the subject investmt is intra. For these reasons, the after-tax OCC applicable to intra-marginal investment should reflect the opportunity cost of the marginal investment (in the asset market), which in turn reflects the tax rate of the marginalinvestor in that mkt.
Why use taxed-investor OCC in tax-exempt disc.rate to compute IV for P.F.?... • Suppose not . . . • Suppose discount Pension Fund after-tax cash flows @ Pension Fund after-tax OCC: • IVA = $106 / 1.06 = $100 = MV. • NPVIV = 0 for P.F. investment, even though PF is tax-advantaged relative to marginal investor! (Recall: NPVIV=IV-MV.) • This would not make sense for Investment Value(IVs are supposed to reflect tax advantage, or disadvantage). For these reasons, the after-tax OCC applicable to intra-marginal investment should reflect the opportunity cost of the marginal investment (in the asset market), which in turn reflects the tax rate of the marginalinvestor in that mkt.