Download
1 / 10
100 likes | 185 Vues
5.3 Populations. Assessment Statements . Outline how population size is affected by natality , immigration, mortality, and emigration. Draw and label a graph showing a sigmoid population growth curve.

E N D
Assessment Statements Outline how population size is affected by natality, immigration, mortality, and emigration. Draw and label a graph showing a sigmoid population growth curve. Explain the reasons for the exponential growth phase, the plateau phase and the transitional phase between these two phases. List 3 factors that set limits to populations.
Population- a group of individuals of the same species that live in the same area. Population numbers can and do change over time and are affected by a number of factors in the environment.
Population Size and Growth What happens if a few individuals of a species enter an unoccupied area. Such as a few rabbits on a new lush island. Assuming there is enough food and there are few predators, the rabbits will reproduce and the population will increase rapidly. After time, when there are large number of individuals, the food supply will start to be used up faster than it can be replaced. The population will be unable to increase and the population will stabilize.
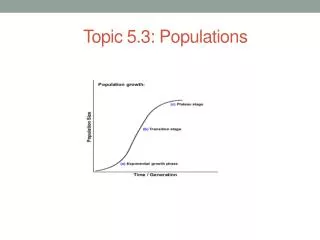
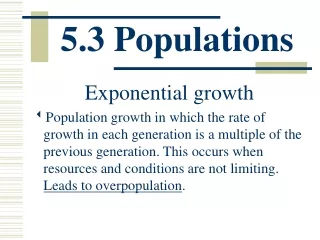
This is a typical pattern of population growth. (Sigmoid Population Curve) As reproduction begins the population shows exponential growth . This is when food is abundant, little competition for space and the effects of predation and disease are minimal.
After a time, the exponential phase ceases and one or more of the resources needed becomes limited. This could be food, water, light, or shelter. Predation, disease, and is some cases toxic wastes accumulate such as carbon dioxide. The shape of the curve shows that the population growth is decreasing and the population is said to be in the transitional phase.
Eventually population numbers become more or less constant and the curve levels off, in the plateau phase.
Exponential Phase- population increases with no restraints. Nutrients are abundant and there is little waste accumulation Transitional Phase- One or more factors in the environment are limiting the rate of reproduction. (food, space, mates, predation, disease, or abiotic factors such as light, O2) Plateau Phase- Numbers of births plus immigration is equal to the number of deaths plus emigration.
Why do Population Sizes Vary? Factors that increase population size: Natality is recruitment to a population through reproduction Immigration from external populations e.g. Bird migration Factor reducing population size: Mortality which is the death rate from any source e.g. predation Emigration, where individuals leave the population for another habitat
Factors that Limit Population Increases Availability of key resources such as food. Water, oxygen, light, space, mates and shelter Disease and predation Levels of waste products, such as CO2 or nitrogenous waste.