Download
1 / 21
210 likes | 384 Vues
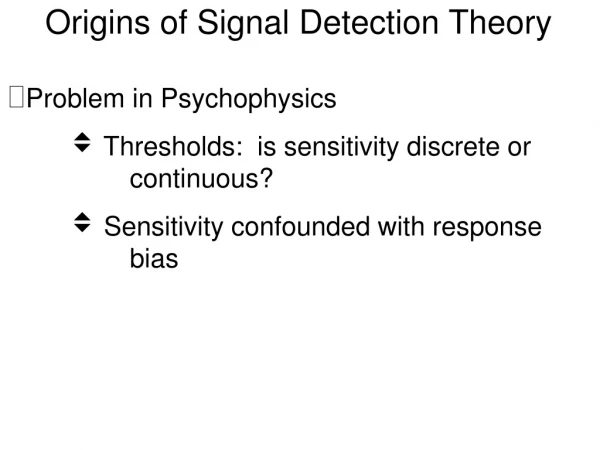
The Very Basics of Detection Theory. J. Scott Tyo tyo@optics.arizona.edu. The Roots of Detection Theory. SDT goes back to the early days of RADAR signal processing Broadly applicable in all areas of sensing Remote Sensing Medical Imagery Communications

E N D
The Very Basics of Detection Theory J. Scott Tyo tyo@optics.arizona.edu
The Roots of Detection Theory • SDT goes back to the early days of RADAR signal processing • Broadly applicable in all areas of sensing • Remote Sensing • Medical Imagery • Communications • Rich literature in psychophysical experimentation
Classic Texts • H. L. Van Trees, Detection, Estimation, and Modulation Theory, Current Edition from Wiley Interscience (2001) • MacMillan & Creelman, Detection Theory: A User’s Guide, Current Edition from Lawrence Erlbaum (2004) • Green & Swets, Signal Detection Theory and Psychophysics, Current Edition from Peninsula Publishing (1989)
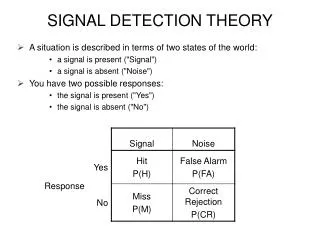
Signal Detection Theory • Signal detection theory provides a model of how well an observer, or in this case a trained program, can correctly identify the signal as the signal and the noise as the noise. From the Masters Defense of Sergio Johnson, UA OSC, 2009
Simple 1-D Signal and Noise Case From the PhD Defense of Oguz Demirci, UNM ECE Department, 2006
Signal Detection Theory cont. • In general, both the signal and the noise are often assumed to be normal distributions with some bias to detecting one over the other. From the Masters Defense of Sergio Johnson, UA OSC, 2009
Signal Detection Theory cont. • The receiver operating characteristic (ROC) curve is a plot that shows the probability of detection as a function of false alarm rate. From the Masters Defense of Sergio Johnson, UA OSC, 2009
LP LP Source Detector LR LR Signal Processing Viewpoint for Mueller Polarimeters Each intensity measurement is this quadratic matrix-vector operation. This operation can be cast as a “dot-product” between Mueller matrix and the fundamental dyad This is the fundamental dyad. It is a rank-one matrix formed by the outer product between the generator and analyzer Stokes vectors.
Deterministic Matched Filter cont. From the Masters Defense of Sergio Johnson, UA OSC, 2009
Deterministic Matched Filter cont. From the Masters Defense of Sergio Johnson, UA OSC, 2009
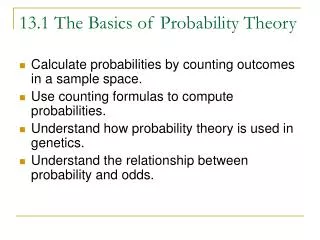
Bayesian Decision Theory • Two hypotheses regarding detction • H0: No target present • H1: Target Present • Generalized Likelihood Ratio Test Probability of making observation x given H0 Decision Threshold Probability of making observation x given H1
Ref: Jimenez (1999) The Gibbs Perceptron in 3-D From the PhD Defense of Oguz Demirci, UNM ECE Department, 2006
Negative Positive All storms (at +48)
ABS Plastic : Damaged × : Virgin +½ -½ New data channel : c1 = m33 - (m22 - m11)/2 1 Invariant Analysis Pose Invariance
Discrimination band ≈ 15% Pose Invariance Constant Channel of damaged c1 = m33 - (m22 - m11)/2 Constant Channel of Virgin Probe Angle ? Probe Angle (°)
Clustering and Segmentation Clusters encompass data over all probe angles
Statistical Distance Metrics • Maximum Likelihood Estimators • Euclidean Distance • Mahalanobis Distance • Manhattan & -norm Distances
Sensor monitors distance (D) from live data to cluster of interest (see video) D
Test / Monitor Demo D positive damage assessment
x 0. 7 0. 6 Whit e?G loss Con tro l 0. 5 Whit e?G loss Te x 1 Whit e?G loss Te x 2 Whit e?G loss Te x 3 0. 4 c 4 0. 3 0. 2 0. 1 0. 5 0 c 1 0. 4 0.35 0. 3 0.25 0. 2 0.15 0. 1 0.05 0 0 c 2 Nonlinear Functional Metric for clusters localized in non-linear channels