Download
1 / 39
390 likes | 459 Vues
Marco Reale University of Canterbury Universidade Federal do Parana, 27 th November 2006. Break-points detection with atheoretical regression trees. Acknowledgements. The results presented are the outcome of joint work with: Carmela Cappelli and William Rea. Structural Breaks.

E N D
Marco Reale University of Canterbury Universidade Federal do Parana, 27th November 2006 Break-points detection with atheoretical regression trees
Acknowledgements The results presented are the outcome of joint work with: Carmela Cappelli and William Rea
Structural Breaks • A structural break is a statement about parameters in the context of a specific model. • A structural break has occurred if at least one of the model parameters has changed value at some point (break-point). • We consider time series data.
Relevance Their detection is important for: • forecasting (latest update of the DGP); • Analysis. With regard to this point a recent debated issue is fractional integration vs structural breaks.
Milestones: Chow 1960 • Test for an a priori candidate break-point. • Splits the sample period in two subperiods and test the equality of the parameter sets with an F statistic. • It cannot be used for unknown dates: misinformation or bias.
Milestones: Quandt 1960 • We can compute Chow statistics for all possible break-points. • If the candidate breakpoint is known a priori, then a Chi-square statistics can be used.
Milestones: CUSUM 1974 • Proposed by Brown, Durbin and Evans. • It checks the cumulative sum of the residuals. • It tests the null of no breakpoints against one or more breakpoints.
Milestones: Andrews 1993 It exploits the Quandt statistics for a priori unknown break-points.
Bai and Perron 1998, 2003 • It finds multiple breaks at unknown times. • Application of Fisher algorithm (1958) to find optimal exhaustive partitions. • It requires prior indication of number of breaks. • Applied recursively after positive indication provided by CUSUM. • Use of AIC to decide the number of breaks.
Bai, Perron and Fisher • Eventually Fisher selects the partition with the minimum deviance. • It is a global optimizer, but was computationally feasible only for very small n and G (even with today's computers). • Using later results in dynamic programming Bai and Perron can use the Fisher algorithm reasonably fast for n=1000 and any G and m. • Fisher’s algorithm is related to regression trees.
Trees (1) • Trees are particular kinds of directed acyclic graphs. • In particular we consider binary trees. • Splits to reduce heterogeneity.
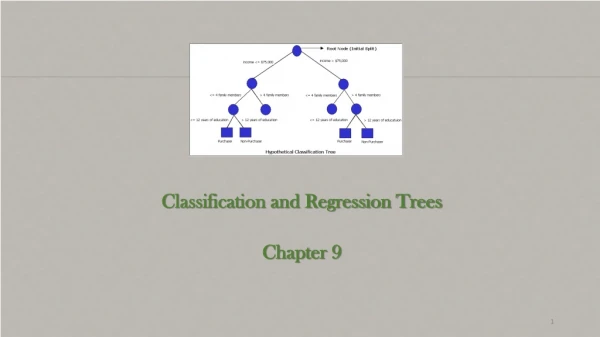
Trees (2) Node 1 is called root. Node 5 is called leaf. The other nodes are called branches.
Regression Trees (1) • Regression trees are sequences of hierarchical dichotomous partitions with maximum homogeneity of y projected by partitions of explanatory variables. • y is a control or response variable.
Regression trees optimality Regression trees don't provide necessarily optimal partitions
Atheoretical Regression Trees • Any artificial strictly ascending or descending sequence as a covariate, e.g. {1,2,3,4...} would do all the optimal dichotomous partitions. • It also works as a counter. • It is not a theory based covariate so the name, Atheoretical regression trees ....yes it's ART. • ART is not a global optimizer.
Pruning the tree Trees tend to oversplit so the overgrown tree needs a pruning procedure: • Cross Validation, is the usual procedure in regression tree, not ideal in general for time series; • AIC (Akaike, 1973) tends to oversplit • BIC (Schwarz, 1978) very good All the information criteria robust for non normality, especially BIC.
Some comments • The simulations show an excellent performance. • However ART performs better in long regimes. • With short regimes it tends to find spurious breaks but the performance can be sensibly improved with an enhanced pruning technique (ETP).
Some comments • BP tends to find breaks any time the CUSUM rejects the null. • It unlikely finds spurious breaks. but • It tends to underestimate the number of breaks.
Application to Michigan-Huron • The Michigan-Huron lakes play a very important role in the U.S. economy and hence they are regularly monitored. • In particular we consider the mean water level (over one year) time series from 1860 to 2000.
Campito Mountain • We applied ART to the Campito Mountain Bristlecone Pine data which is an unbroken set of tree ring widths covering the period 3435BC to1969AD. A series of this length can be analyzed by ART in a few seconds. BPP was applied to the series and took more than 200 hours of CPU time to complete.Tree ring data are used as proxies for past climatic conditions.
The four most recent periods… …are: • 1863-1969: Industrialization and global warming. • 1333-1862: The Little Ice Age. • 1018-1332: The Medieval Climate Optimum. • 862-1017: Extreme drought in the Sierra Nevadas.
Niceties of ART • Speed: Art has O(n(t)) while BP O(nng). • Simplicity: it can be easily implemented or run with packages implementing regression trees. • Feasibility: it can be used without almost any limitation on either the number of observations or the number of segments. • Visualization: it results in a hierarchical tree diagram that allows for inputation of a priori knowledge.
…and ... and of course you can say you're doing ART