Download
1 / 62
620 likes | 726 Vues
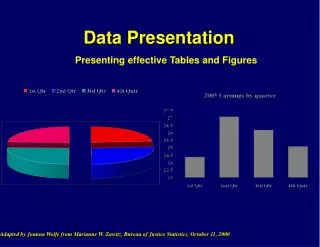
Data Presentation. Lulu Eva Rakhmilla Epidemiology & Biostatistics Department FMUP. Introduction. When deciding how to display data ask yourself two questions: What is it that I want to say? Does my chosen method/ chart/ table actually show what I want it to show?. Introduction.

E N D
Data Presentation Lulu Eva Rakhmilla Epidemiology & Biostatistics Department FMUP
Introduction • When deciding how to display data ask yourself two questions: • What is it that I want to say? • Does my chosen method/ chart/ table actuallyshow what I want it to show?
Introduction • Know your audience • Decide what you want to present Are youpresenting data or are you presenting results? • Tables are good for quantification • Charts are good for illustrating specific points
Why this content necessary • All the medical sciences, physiology, biochemistry, psychology etc. use quantitative data. • It is important to be ableto manipulate and summarise these data correctly • For research to be worthwhile, data mustbe presented meaningfully and correctly interpreted
This use of figures and tables to makesense of data has a long and distinguished history……
Both the previous charts were drawnwithout the aid of graphics packages • You have no excuse not to get it right! • A more recent example of how datadisplay can illuminate an issue…
“Graphic Excellence is that which gives to the viewer the greatest number of ideas in the shortest time with the least ink in the smallest place.” Edward R. Tufte
l l l l l 7 8 5 l l 4 l l 6 l l l l l l l 9 l l l l l l l l l l l l l l l l l l 2 l l l l l l l l l l l l l l l l l l l l l l l l l l l l l l l l l l l 3 l l l 10 l 1 l l l l l l l l l l l l l l l l l l l l l l l Mediterranean sea Asthma cases in Barcelona by districtJanuary 21, 2011
Distribution by time of day More informatif...........
Guidelines • Simplify message without falsifying data • Generally need either graph or table • Present with clarity, brevity • Note prior minor thesis guidelines
Data Presentation Formats • Tables • Specific data • Exact comparisons between data points • Bar Charts • Less numerically specific • Examine differences rather than trends/changes • Comparisons of size, magnitude, amounts • Line Graphs • Not numerically specific • Demonstrate movement, change, trends • Generally over time or concentration
Using a Table • Should be able to stand on its own • Show data, and possible manipulations • Percentages, totals, means, averages, ratios, etc. • Columns contain Ind. Variables (that which was manipulated
Good Table • Legend- complete • Stands on own • Note capitalization • Period after "Table 2" • Units included • Legend above the table; • Note clarifying footnote • Lines of demarcation separate numerical data from text. • Gridlines not present
More on Tables • Limit total items/columns • (But more than than 6-8 datapoints) • No vertical lines • Do not overload with headings • Use captions/footnotes for definitions • Strings of “0’s” or unchanging data might not be included • Use restraint with decimal places • Obvious abbreviations can be included • Don’t repeat data in text, just call attention to main points
Preparing a Table • Examine style sheet and examples • One table, one page, double spaced • Use Arabic numerals to number • Group so that comparisons run down column • Logically group data to stress baseline and trends • Round off numbers and align decimals • Create a descriptive caption (no verb required) • Use head- or foot-notes to explain abbreviations • Verify all data • Verify accuracy of use of symbols • Use consistent labeling throughout paper • Proofread carefully
Tables in a Poster/Presentation • Time limitations- make more simple • Utilize color, shapes, to emphasize • Symbols are okay
Actually Making a Table • Use publisher’s recommendations • Can use Word or Excel (I like Excel)
Illustrations Photographs Drawings Flowcharts Line graphs Bar graphs Pie charts Maps Figures
Figures • Designed to add understanding of information that it difficult to convey with words • Must be clear, accurate, appropriate • Avoid mere decoration • Need a legend
Line Graphs • Should have two axes • Y changes as a function of X • Should show data collected at regular intervals (show trends) • Make curves most bold • Don’t vary line patterns, vary symbols (color on slides/posters) • Plot the length of intervals so that slopes are not too steep.
Bar Charts • One measurable axis • Interval doesn’t matter • Make bars wider than the spaces between them. • Use color only in slides/posters. Use conservative patterns for publication • Show significant differences by letter or asterisk above bars
Scatter Plots • Examines individual score on two variables. • Show relationship • Independent Variable on X (“as a function of”)
Recommendations for Figures • Read guideline regarding size, color, format! • Is it needed? • Do not have a title • Can it be understood at a glance? • Limit curves (3-5) or bars (6-8; 9-10 grouped) • Plot independent variable on X (time, concentration), dependent on Y (what happened?) • Avoid wasted space; legend on field
Recommendations (2) • Label axes and show units of measure. Use tics and subtics, to not crowd with numbers • Position, size, shape, length, symbols, angle, color: all are cues. Use when appropriate, and avoid misuse. • Start scales at “0,” unless you make it clear (tic marks) that you are doing otherwise. • For a journal, type caption on a separate page so that the figure can be photographed and the type set separately.
Figure Legends • Must accompany Figures. • Should give pertinent, clarifying information • key to abbreviations • sample size • statistical results • a brief description of how the data were acquired • Should allow Table/Figure to stand alone • In the legend, both “Table” and “Figure” are spelled out completely
How to refer to a Table/Figure • Every table/figure must be referred to in the text • It is best to refer to them in parenthesis: • Germination rates were significantly higher after 24 hr water soak than in the control (Fig. 1) . • Note: Fig., here is abbreviated. Not on headings, though. • Avoid sentences that only direct you to the table: • Table 1 shows the summary results for male and female height at Bates College.
Tabulating and Graphing Numerical Data Numerical Data 41, 24, 32, 26, 27, 27, 30, 24, 38, 21 Frequency Distributions Cumulative Distributions Ordered Array 21, 24, 24, 26, 27, 27, 30, 32, 38, 41 2144677 3 028 41 Ogive Histograms StemandLeaf Display Polygons Tables
Graphing Categorical Data: Univariate Data Categorical Data Graphing Data Tabulating Data The Summary Table Pie Charts Pareto Diagram Bar Charts
Swinscow TDV, Campbell MJ. Statistics at Square One. 10 ed. Sheffield: BMJ Pub; 2002.
Purpose of a research talk Is not to • Impress the audience • Tell them all you know about a subject • Present every little detail of your work Is to • Give the audience a sense of what your idea/work is • Make them want to read your paper • Get feedback on your work
Know your audience • Who would be there? • Scientists expert in your field • Scientists not expert in your field • Non experts • Who knows? Most likely a mix so have something for all
Know your audience • Keep in mind • They might be tired • They can read • They are thinking “Why should I listen?” • Non-experts will tune off within 2 minutes • Experts after 5 minutes • What can you do?
What can you do? • Early motivation - at the beginning of your talk motivate your research with easy to understand examples • Spoil the punch line - State your results early and in simple terms • Visuals – Illustrate your idea with images and diagrams
Leave them with these thoughts • I understood what the problem was and why it was important • I have an idea of what her solution was and how it was different/better than others • She knows the literature (i.e. quoted my work ) and we might collaborate on this aspect of her research
Use examples Examples are your weapon to • Motivate your work • Illustrate the basic intuition • Show your solution in action • Highlight extreme cases or shortcomings If you are running out of time cut the general case not the example
Where were you? Preprocessing Filtering Texture Extraction Decision Trees Classification Preprocessing Filtering Texture Extraction Decision Trees Classification • People will get lost during your talk, even those who are listening • have a running outline of the main steps of your idea (more than the talk itself) • use visual clue to highlight where you are in the process • present it at the beginning of each step
Related work • Be familiar with all related work • Don’t list each paper you read • Mainly talk about results that are immediately related to what you did • References at the end of the talk or better in the paper itself • Acknowledge co-authors (title slide)
Technical details: in or out? A fine line • Present specific aspect that show the “meat” of your work • Leave the rest out. If you were convincing they will read your paper • Don’t fill up your slides with lots of equations • Prepare back-up slides to answer questions. Leave them at the end of the presentation
The skeleton • What is the problem • Motivation and goals • Relevant state of the art • What is your key idea/contribution • Why is your approach good/better • What I just said and what I want to do next
Preparing the presentation • Less is more. Fill in with narration not words • Use animation sparingly • Use color to emphasize some points but limit to 2 or 3 • Be consistent! In the choice and use of color font size/type etc • Use slide real estate appropriately
Slide layout - Bad • This page contains too many words for a presentation slide. It is not written in point form, making it difficult both for your audience to read and for you to present each point. Although there are exactly the same number of points on this slide as the previous slide, it looks much more complicated. In short, your audience will spend too much time trying to read this paragraph instead of listening to you.
Slide layout – Good • Show one point at a time: • Will help audience concentrate on what you are saying • Will prevent audience from reading ahead • Will help you keep your presentation focused
Fonts - Good • Use a decent font size • Use different size fonts for main points and secondary points • this font is 24-point, the main point font is 32-point, and the title font is 44-point • Use a standard font like Times New Roman or Arial
Fonts - Bad • If you use a small font, your audience won’t be able to read what you have written • CAPITALIZE ONLY WHEN NECESSARY. IT IS DIFFICULT TO READ • Don’t use a complicated font
Color - Good • Use font color that contrasts sharply with the background • Blue font on white background • Use color to reinforce the logic of your structure • Ex: light blue title and dark blue text • Use color to emphasize a point • But only use this occasionally
Color - Bad • Using a font color that does not contrast with the background color is hard to read • Using color for decoration is distracting and annoying. • Using a different color for each point is unnecessary • Same for secondary points • Trying tobe creativecan alsobe bad