Download
1 / 20
200 likes | 324 Vues
Lecture 19 The Ocean Nitrogen Cycle. Denitrification Reactions Distributions Nitrogen Fixation Reactions Distributions. Main Ocean Source of N Nitrogen Fixation Enzyme catalyzed reduction of N 2 N 2 + 8H + + 8e - + 16 ATP → 2NH 3 + H 2 + 16 ADP + 16P i

E N D
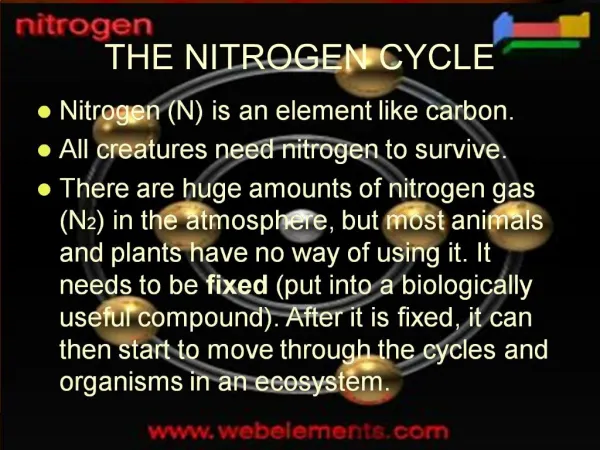
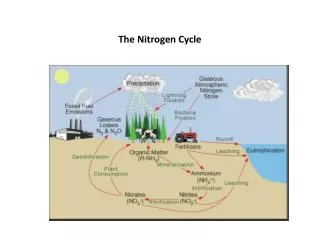
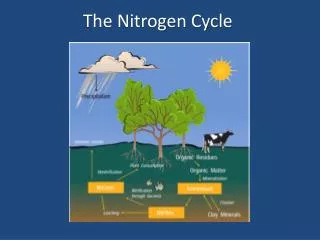
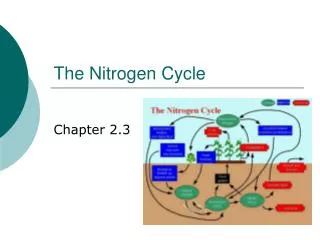
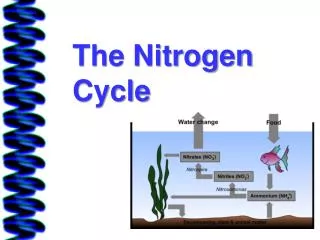
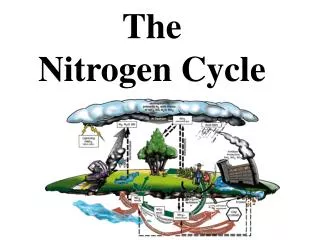
Lecture 19 The Ocean Nitrogen Cycle Denitrification Reactions Distributions Nitrogen Fixation Reactions Distributions
Main Ocean Source of N Nitrogen Fixation Enzyme catalyzed reduction of N2 N2 + 8H+ + 8e- + 16 ATP → 2NH3 + H2 + 16 ADP + 16Pi Mediated by a two protein (Fe and Fe-Mo) complex called nitrogenase Inactivated when exposed to O2
Main Ocean Sink of N Fixed Nitrogen (NO3-, NO2-, NH4+) is converted to N2 in low oxygen zones of the ocean Two Pathways Denitrification ( <2 to 10 mM O2): 2 NO3- + organic matter → N2 Anammox (<2 mM O2) NH4+ + NO2- → N2 + H2O
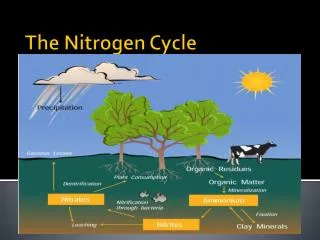
Schematic of Ocean Nitrogen Cycle Gruber (2005) Nature 436, 786
Global distribution of O2 at the depth of the oxygen minimum Gruber and Sarmiento, 1997
Coupling of N sources and sinks (Deutsch et al, 2007, Nature, 445, 163) Capone and Knapp (2007) Nature, 445, 159
What is N*? The solid line shows the linear equation P = 1/16 N + 0.345 (equivalent to N* = 0) Values to the right have positive N*, to the left have negative N* N* is defined as N* = [NO3] – 16 x [PO4] +2.9 PO4 versus Nitrate (GEOSECS data) Insert shows the effect of nitrification, photosynthesis, N2 fixation and denitrification.
N* is defined as N* = [NO3] – 16 x [PO4] +2.9
Nitrogen Cycle w/ anammox Kuypers (2003) Nature 422: 608-611.
Why is this important for chemical oceanography? What controls ocean C, N, P? g ≈ 1.0 Mass Balance for whole ocean: C/ t = VRCR – f B CS = 0; CD = CD VU = VD = VMIX Negative Feedback Control: if VMIX↑ VUCD↑ B ↑ f B ↑ (assumes f will be constant!) assume VRCR then CD↓ (because total ocean balance VUCD↓ has changed; sink > source) B ↓ The nutrient concentration of the deep ocean will adjust so that the fraction of B preserved in the sediments equals river input! CS CD if VMIX = m y-1 and C = mol m-3 flux = mol m-2 y-1
Nitrogen species: NO3- ; NO2- ; N2O; N2 ; NH4+ (V) (III) (I) (0) (-III) Nitrogen Isotopes: 14N 99.634% 15N 0.366% Isotopic Composition: ‰ The standard is atmospheric N2
Fractionation factors , where e is the isotopic enrichment factor Fractionation Heavier stable isotope forms stronger bond. Microbial Enzymes break light isotope bonds more easily. Reactants become heavier (enriched) (e.g. NO3-→ N2) Products become lighter (depleted) Partial versus total reaction (products have same values as reactants)
The Global Nitrogen Budget-one example (Brandes et al, 2002)
% of Export Production (as N) at HOT derived from N2 Fixation (N-P mass balance model of Karl et al (1997) Nature 388, p. 533)
The Global Nitrogen Budget-one example (Brandes et al, 2002)
Spatial coupling of N2 fixation and denitrification (Deutsch et al, 2007)
Downcore records of 15N-orgN from several sites High values of 15N-OrgN suggest more extensive denitrification Deutsch et al, 2004)