Download
1 / 59
600 likes | 789 Vues
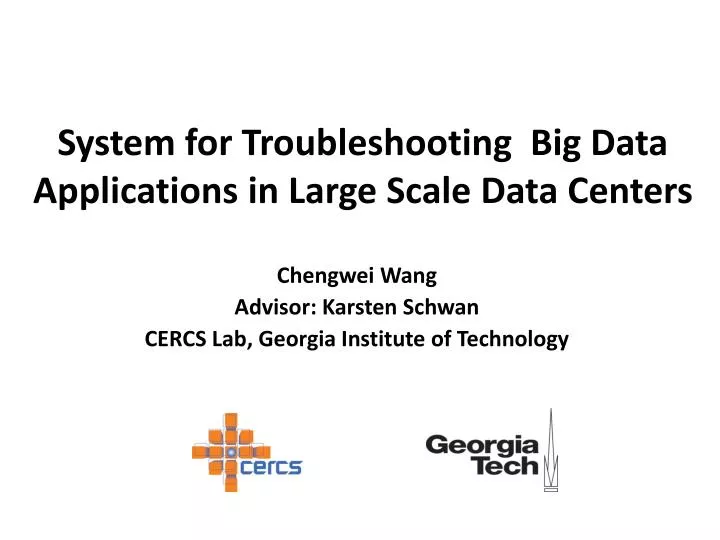
System for Troubleshooting Big Data Applications in Large Scale Data Centers. Chengwei Wang Advisor: Karsten Schwan CERCS Lab, Georgia Institute of Technology. Collaborators. Canturk Isci (IBM Research)

E N D
System for Troubleshooting Big Data Applications in Large Scale Data Centers Chengwei Wang Advisor: KarstenSchwan CERCS Lab, Georgia Institute of Technology
Collaborators • Canturk Isci (IBM Research) • Vanish Talwar, Krishna Viswanathan, Lakshminarayan Choudur, Parthasarathy Ranganathan, Greg MacDonald, Wade Satterfield, (HP Labs) • Mohamed Mansour (Amazon.com) • Dani Ryan (Riot Games) • Greg Eisenhauer, Matthew Wolf, Chad Huneycutt, Liting Hu (CERCS, Georgia Tech)
Large Scale Data Center Hardware Routers, Switches, Network Topologies …. 5 x 40 x 10 x 4 x 16 x 2 x 32 = 8’192’000 cores (8 million + VMs) Amazon EC2 has estimated 454,400 (~0.5 million) Servers.
Large Scale Data Center Software Web APP Big Data Stream Data Twitter Storm
‘Big Data’ Application Data Blocks (PageID, # views) Page Views Exposed as Services in Utility Cloud
Troubleshooting War On Christmas Eve Based 2010 quarterly revenues, downtime could cost up to $1.75 million/hour Not a perfect Christmas …… Amazon engineers find the root cause Data state merge process completed Amazon ELB state data accidentally deleted Recover ELB state data to state before it is deleted Netflix Streaming Outage War is over, well, forever? 12:24 PM 12:30 PM 17:02 PM 2:45 AM 12/25/2012 5:40 AM 12/25/2012 8:15 AM 12/25/2012 Local Issue API partially affected A large number of ELB services need to be recovered Global Issue ELB Requests High Latency
Challenges for Troubleshooting E2E Latency ? ? ? • Large Scale : thousands to millions entities • Dynamism : dynamic interactions/dependencies • Overhead : profiling/tracing information required • Time-Sensitive : responsive troubleshooting online
Research Components Modeling Monitoring/Analytics System Design2 Statistical Anomaly Detection: EbAT, Tukey, Goodness-of-Fit3,4 Anomaly Ranking5 Guidance VScope: Middleware for Troubleshooting Big Data APPs1 VScope: Middleware for Troubleshooting Time-Sensitive Data Center Applications, Middleware’12. A Flexible Architecture Integrating Monitoring and Analytics for Managing Large-Scale Data Centers, ICAC’11 Statistical Techniques for Online Anomaly Detection in Data Centers, IM’11 Online Detection of Utility Cloud Anomalies Using Metric Distribution, NOMS’10 Ranking Anomalies in Data Centers, NOMS’12
Research Components Modeling Monitoring/Analytics System Design Statistical Anomaly Detection: EbAT, Tukey, Goodness-of-Fit Anomaly Ranking Guidance VScope: Middleware for Troubleshooting Big Data APPs
What is VScope? • From systems perspective,VScope is a distributed system for monitoring and analyzing metrics in data centers. • From user’s perspective, VScope is a tool providing dynamic mechanisms and basic operations to facilitate troubleshooting.
Human Troubleshooting Activities Anomaly Detection Interaction Analysis Profiling & Tracing Monitoring agent latency, Alarm when latency high Which collector did the problematic agent talk to? RPC-log in regionservers Debug-log in data nodes Which regionservers did the collector talk to? Which agents had the abnormal latencies?
VScope Operations Anomaly Detection Profiling & Tracing Interaction Analysis Watch Scope Query Dynamic metric collection/analytics deployment Continuous anomaly detection On-line interaction tracking
Distributed Processing Graph (DPG) Global Results Look-Back Window VNode Metrics Local Analysis Results Local Analysis Results Flexible Topology Aggregate Monitoring Data VNode VNode Metrics Metrics Metrics
VScope System Architecture VScope/DPG Operations VShell metric function library library VMaster DPGManager DPGManager DPG DPG DPG Initiate, Change, Terminate VNode Dom0 DomU DomU Xen Hypervisor Flume master collector agent
Troubleshooting Layer Watch Scope Query Guidance Anomaly Detection & Interaction Tracking DPGs API& Cmds DPG Layer VScope Runtime VScope Software Stack
Usecase I: Culprit Region Servers Slow? Which? E2E Perf. Low Normal Inter-Tier Issue: When you see E2E Performance is slow, was it due to collector or region server issues? Scale: There could be thousands of region servers! Interference: High interference when turning on debug-level java logging.
iterative analysis Using Connection Graph Analyzing Timing in RPC-level logs E2E Latency Entropy Detection SLA Violation on Latency Related Collectors& Region Servers Dynamically Turn on Debugging Horizontal Guidance (Across Tiers) Flume Agents Query Watch Scope Abnormal Flume Agents Shared RegionServers Processing Time in RegionServers
VScopevs Traditional Solutions 20 Region Servers, One Culprit Server VScope has highly reduced interference to application.
Usecase II: Naughty VM Good VM Naughty VM Hypervisor Slow Agent Slave/ TaskTracker Over-consume Shared Resource (Due to heavy HDFS I/O) Inter-Software-Level Issue: it is hard to find the root cause without knowing VM-Machine mapping.
Vertical Guidance (Across SW Levels) Watch E2E Latency Query Good VM Scope/Query Hypervisor Scope/Query Naughty VM HDFS I/O Remedy
VScope PerformanceEvaluation • What’re the monitoring overheads? • How fast can VScope deploy a DPG? • How fast can VScope track interactions? • How well can VScope support analytics functions?
EvaluationSetup • Deployed VScope on CERCS Cloud (using OpenStack) hosting 1200 Xen Virtual Machines (VMs). http://cloud.cercs.gatech.edu/ • Each VM has 2GB memory and at least 10G disk space. • Ubuntu Linux Servers (1TB SATA disk, 48GB Memory, and 16 CPUs (2.40GHz). • Cluster with 1 GB Ethernet networks.
GTStream Benchmark Data Blocks (PageID, # views) Page Views
VScope Runtime Overheads DPGs are doing anomaly detection and interaction tracking VScope has low overheads.
DPG Deployment Deploy balanced-tree DPG on VMs with different BFs (Branching Factor) #of vms Fast DPG deployment at large scale with various topologies
Interaction Tracking Tracking network connection relations between VMs #of vms Fast interaction tracking at large scale
Analytics Support Measuring deployment & computation time on with real analytics Efficiently support a variety of analytics.
VScope Features VScope Advantages: Controllable Interference Guided/Focused Troubleshooting
Research Components Modeling Monitoring/Analytics System Design Statistical Anomaly Detection: EbAT, Tukey, Goodness-of-Fit Anomaly Ranking Guidance VScope: Middleware for Troubleshooting Big Data APPs
Monitoring/Analysis System Design Choices • Traditional Design • Novel System Design (Using DPG) > Hybrid: Federating Various Topologies > Dynamic: Topologies On-Demand Centralized Balanced Tree Binomial Tree
Modeling Monitoring/Analysis System Performance/Cost • Is there the best design choice in for all scales? • How does scale affect system design? • How do analytics features affect system design? • How do data center configs. affect system design? • Is there any tradeoff between performance/cost?
Data Center Parameters *Example values are quoted from publications or gained from micro-benchmark experiments and experiences of HP production teams
Performance/Cost Metrics • Performance: Time to Insight (TTI) The latency between the time when (a) monitoring metric(s) is(are) collected and the time when the analysis of the metric(s) is done. • Cost: Capital Cost for Management Dollar amount spent on hardware/software for monitoring/analytics.
Compare Topologies at Scale Analytics O(N2) Complexity Analytics O(N) Complexity Capital Cost • No one is the best in all configurations • High performance may incur high cost • Hybrid design may be a good choice
Trade-off of Performance/Cost Lowest TTI Highest Cost • Hierarchical Tree (fanout 2) has best performance but has highest cost • Centralized has best performance and lowest cost when <2000 nodes, but worst performance when >6000 Best
Insights • No static, ‘one size fits all’, topology • Design may tradeoff performance/cost • DPG can provide dynamic topology and analytics variety support at large scale • Novel, hybrid topology can yield good performance/cost. • The principles we follow in VScope.
Research Components Modeling Monitoring/Analytics System Design Statistical Anomaly Detection: EbAT, Tukey, Goodness-of-Fit Anomaly Ranking Guidance VScope: Middleware for Troubleshooting Big Data APPs
Statistical Anomaly Detection • Distribution-based anomaly detection • Online • Integrated into VScope • Dynamically deployed by VScope
A Brief Summary • Entropy-based Anomaly Tester (EbAT) • Leveraging Tukey Method and Chi-Square Test • Experiment on Real-World Data Center Traces
Conclusion • VScope is a scalable, dynamic, lightweight middleware for troubleshooting real-time big data applications. • We validate VScope in large-scale cloud environment with a realistic multi-tier stream processing benchmark. • We showcase VScope’s abilities of troubleshooting horizontally across-tiers and vertically across-software-levels in two real-world use cases. • Through analytical modeling, we concludes that dynamism, flexibility, and tradeoff between performance and cost are needed for large scale monitoring/analytics system design. • We proposed statistical anomaly detection algorithms based on distribution change rather than change in individual measurements
State of the Art: System Analytics Dynamism Complexity/Online Scale Ph.D. Thesis Research Area Cloud Moara SIAT Ganglia Data Center Hyp. HQ Console mining Chukwa G.work Openview/Tivoli Cluster Dynamic PMP Osmius sherlock CLUE Multi-Tier pinpoint sar ps regression Dapper Single host Static slick Fay magpie vmstat GWP top Chopstix Lack systems and algorithms to support dynamic, online, complex diagnosis at large scale
Future Work • System Analytics • Large scale complexities, a variety of workloads, big data (system logs, application traces) • Cloud Management (resource management, troubleshooting, migration planning, performance/cost analysis); Power Management; Performance optimization, etc. • Investigating/Leveraging large scale, online, machine learning and data mining for system analytics
VScope System Architecture VScope/DPG Operations Query VShell metric function OpenTSDB library library VMaster DPGManager DPGManager DPG DPG DPG Historical Data Initiate, Change, Terminate VNode TSD TSD Time-Series Daemon Dom0 DomU DomU Xen Hypervisor Flume master collector agent
Why Dynamism is Important? We cannot afford tracing everywhere!
Distribution-based vs Value-based • Sporadic Spikes • Pattern vs individual measurement
EbAT (Entropy-based Anomaly Tester) Threshold-based 1. Visual Identification 2. Three-Sigma Rule Signal Processing 1. Wavelet Analysis Time Series Analysis 1. Exponential Weighted Moving Average (EWMA)
Entropy Time Series Construction 1. Maintain look back window Example Look-back window of Size 3 Look back windows • 2. Perform data pre-processing • Normalization: divide values • by mean of samples • Data binning: hash values into a bin of size m+1