Download
1 / 33
450 likes | 989 Vues
Neutral Theory: From molecular evolution to community ecology Fangliang He Department of Renewable Resources University of Alberta. “ Nothing in biology makes sense except in the light of evolution.” Dobzhansky (1973). A Brief History of (Molecular) Evolution.

E N D
Neutral Theory: From molecular evolution to community ecology Fangliang He Department of Renewable Resources University of Alberta
“Nothing in biology makes sense except in the light of evolution.” Dobzhansky (1973)
A Brief History of (Molecular) Evolution • In 1859, Charles Darwin proposed that: • (1) all organisms on earth evolved from a single proto-organism by descend with modification, • (2) the primary force of evolution is natural selection. • Natural selection is not the only force of evolution, may not even be a dominant force. The alternative mechanisms: transmutation theory, Lamarckism, geographical isolation, and nonadaptive evolution. • Mutationism: represented by the post-Mandelian geneticist Morgan in 1920’s. A strong critic of natural selection, argued for the importance of advantageous mutations. Natural selection merely serves as a sieve to filter deleterious mutations. (Also proposed that some part of morphological evolution is caused by neutral mutation.) Nei, M. 2005. Selectionism and neutralism in molecular evolution. Mol. Biol. Evol. 22:2318-2342.
Neo-Darwinism:Represented by Fisher, Wright, Haldane, Dobzhansky in the 30-50’s. Natural selection is claimed to play much more role than mutation. Two main reasons: • (1) the amount of genetic variation contained in natural populations are so large that any genetic change can occur by natural selection with no need of new mutations, • (2) math showed that the gene frequency change by selection the change by mutation. • Neutralism in 60’s: The foundation of Neo-Darwinism started to shake as molecular data on evolution accumulated in the 60’s. Evidence: • (1) Amino acid sequences show that most amino acid substitutions in a protein do not change the protein function (hemoglobins血红蛋白, cytochrome c细胞色素, fibrinopetides纤维蛋白钛), • (2) Genetic variation within populations is much higher than previously thought.
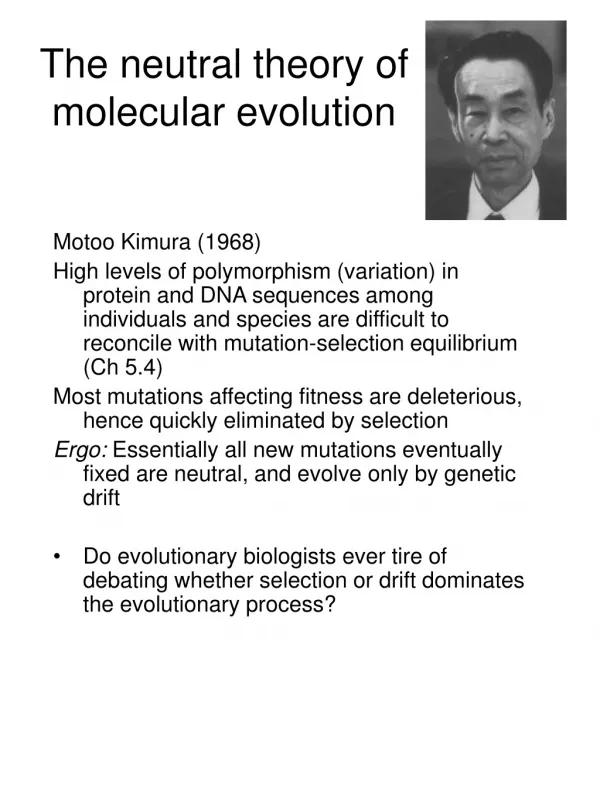
Neutral Theory of Molecular Evolution Neutral theory: Most molecular polymorphism and substitutions are due to neutral mutations and genetic drift. Genetic drift is the main force changing allele frequencies. Hemoglobins are evolving at a steady rate of 1.410-7 amino acid substitutions/yr ~ one nucleotide pair/2 yr (too high based on the cost of natural selection). Kimura (1968) argued that many of the substituted alleles must be neutral. King and Jukes independently proposed that most amino acid substitutions are neutral. The inverse relationship between the importance of a protein or site within a protein and its rate of evolution (Principle of Molecular Evolution). Kimura, M. 1968. Evolutionary rate at the molecular level. Nature 217:624-626. King, J. L. and Jukes, T. H. 1969. Non-Darwinian evolution. Science 164:788-798.
Items Population genetics Macroecology Operational units Population Metacommunity Subdivision Subpopulations Local communities Focal unit Gene Species Observed data Allele frequency Species abundance Neutral definition Alleles are selectively neutral, Individuals have equal vital rates selection coefficient 0, or < 1/2Ne Driving forcesGenetic drift (1/2Ne) Ecological drift (1/JM or 1/JL) Mutation Speciation Gene flow among subpopulations Dispersal among local communities Spatial structure Population genetic structure Species distribution and abundance variation among local communities Model Island model Island biogeography Stepping stone model Isolation by distance Dispersal limitation Mainland-island Metacommunity-local community Cline pattern (speciation phases) MeasurementFis diversity Fst diversity Spatial autocorrelation Species-area power law Parameters = 4Ne = 4JM or = 4JL Average number of migrants (Nem) Average number of migrants (JLm) Effective population size (Ne) Effective community size (JM or JL) Distribution of allele frequency Distribution of species abundance Fixed (extinct) probability of an allele Fixed (extinct) probability of a species Assembly rules Genetic drift/mutation Ecological drift/speciation Genetic drift/migration Ecological drift/dispersal Genetic drift/migration/mutation Ecological drift/dispersal/ speciation Mathematical tools Statistical methods Statistical methods Diffusion model Diffusion model Coalescent theory Phylogeny Hu et al. 2006. Oikos 113:548-556.
where Heterozygosity expected from mutation vs random drift. Infinite-allele Model Ft: the probability that two randomly sampled alleles at generation t are identical. : mutation rate. Kimura, M. & Crow, J.F. 1964. The number of alleles that can be maintained in a finite population. Genetics 49:725-738.
where Frequency of Spectrum Ewens, W.J. 1972. The sampling theory of selectively neutral alleles. Theor. Popul. Biol. 3:87-112.
Age of Species Time Overestimate the age of tree species in orders! p Kimura, M. 1983. The neutral allele theory of molecular evolution. Cambridge Univ. Press.
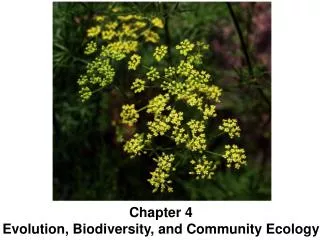
Community Assembly Rules Atmospheric inputs Genetic structure Size structure Age structure Disturb: Winds Fires Logging Pollution ..... Birth Death Growth Competition Predation ..... Community Patterns Species composition Temporal structure Spatial structure Edaphic conditions Geographical processes
Hubbell’s Neutral Theory • Random walk • Dispersal limitation • Speciation
Metacommunity Neutral Model Expected diversity (Simpson index): Expected # of species: Species-abundance model: Hubbell, S.P. 2001. The unified neutral theory of biodiversity and biogeography. Princeton Univ. Press.
0 j-1 j j+1 N Fixation Initial state Extinction … 0 1 2 3 N 0 1 2 … N Random Walk
0 j-1 j j+1 N Fixation Initial state Extinction Probability of Extinction Competitive exclusion in the two species system occurs if the red species starting from j is finally absorbed into either state N (the red species wins) or 0 (the blue species wins). The probability to extinction is defined as chance for the focal species traveling from j to 0.
0 j-1 j j+1 N Fixation Initial state Extinction Time to Extinction The time to extinction is defined as the average # of steps for the focal species traveling from j to N or 0.
Extinction time Extinction probability N = 20 tj pj N = 20 j j
Differential Birth Rates Zhang and Lin (1997) consider the case of differential birth rates N = 100 j = 50 t u u 1, higher birth rate in focal species Zhang, D. Y. & Lin, K. 1997. The effects of competitive asymmetry on the rate of competitive displacement: how robust is Hubbell’s community drift model? J Theor Biol 188:361-367.
Differential Death Rates Yu et al (1998) consider the case of differential death rates by simulation. Yu, D. W., Terborgh, J. W. & Potts, M. D. 1998. Can high tree species richness be explained by Hubbell’s null model? Ecol Lett 1:193-199.
Differential Birth & Death Rates Metacommunity model P is the prob of sampling an individual from the focal species (abundance = j) and Q is the prob of sampling an individual from the other species (abundance = N-j). P+Q =1. If we randomly sample one individual from the community (to kill), the prob that the sampled individual belongs to the other species (not the focal species) is: where This leads to ,
d c ej v extinction u v fixation u Effects of Birth and Death Rates on Coexistence Prob. N = 50 j = 25
f e extinction fixation ej v u N = 50 j = 45
tj v u Effects of Birth and Death Rates on Coexistence Time N = 50 j = 25
f e tj v u v N = 50 j = 25
v = 1 v = 1.2 v = 1.1 tj v = 1.5 v = 1.8 v = 2 t tj v u u u u t-u profiles for different death rates v’s. N = 50 j = 25
N = 50 j = 25 N = 50 j = 5 ej m u u Effects of Birth and Death Rates on Extinction
v=1 tj m v=1.2 tj m u u Effects of Birth, Death & Immigration Rates on Coexistence
Summary • The nearly neutral model which generalizes Hubbell’s neutral theory. • Birth and death have compensatory effects on coexistence but their effects are not symmetric. Birth rates must be slightly higher than death rates to maintain maximum coexistence. • The nearly neutral models provide a potential theory for reconciling neutral and niche paradigms (?) • Immigration cannot prevent eventual extinction of a species but will always increase the time of coexistence. • Nearly neutral systems have substantially shorter time of coexistence than that of neutral systems. This reduced time provides a promising solution to the “problem of time”.
Metacommunity model Local community model
t v u The variation in birth and death rates (subject to niche differentiation) determines the fitness landscape. The focal species j has a higher fitness (higher u, lower v) than the other species. In this case, there is a strong competitive exclusion, thus a short coexistence time. The effects of birth rate (u) and death rate (v) on species coexistence are not symmetric. A slightly higher birth rate than the death rate is needed to maintain a maximum coexistence. x
t v u The Problem of Time
Future Work • Derive macroecological patterns (species-abundance distribution, species-area curves etc) as functions of u, v and m. • Investigate trade-off in u and v. • Develop methods for testing the nearly neutral theory.