Download
1 / 38
380 likes | 503 Vues
Shale Resources in Ohio. By Amanda Weinstein Swank Program in Rural-Urban Policy http://aede.osu.edu/programs/swank Weinstein.74@osu.edu NAIOP Conference October 24, 2012 Cincinnati, OH. Outline. Introduction Shale Resources Hydraulic Fracturing Local Impact Economic Impact

E N D
Shale Resources in Ohio By Amanda Weinstein Swank Program in Rural-Urban Policy http://aede.osu.edu/programs/swank Weinstein.74@osu.edu NAIOP Conference October 24, 2012 Cincinnati, OH
Outline Introduction Shale Resources Hydraulic Fracturing Local Impact Economic Impact Environmental Impact Conclusions
Introduction • Innovations in extracting oil and natural gas trapped below the surface in shale have led to oil and gas booms across the country • Innovations include microseismic technology, horizontal drilling, hydraulic fracturing • Brought oil and gas booms in new areas such as Pennsylvania and more recently Ohio • Brought concerns about the various impacts of the boom on the local community
Shale Oil and Gas Shale is a sedimentary rock that is formed as particles of sediment settle in calm water. Shale rock is generally high in organic content. Once covered up by other sediments and buried over millions of years, heat and pressure begin to work on these sediments and oil and gas are formed. Many of the shale formations in the U.S. were formed during the Devonian period, around 390 million years ago. “Conventional” oil and gas reserves occur when some of the oil and gas has migrated upwards, to layers of sandstone and porous limestone where it becomes trapped. In some cases, a significant quantity of oil and gas remain in the shale rock. These reserves are called “unconventional”
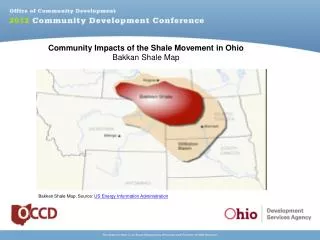
Shale Plays Across the U.S. According to the U.S. EIA (2011) there is approximately 750 trillion cubic feet of gas and 24 billion barrels of oil yet to be developed The largest shale plays in terms recoverable oil are the Monterey, Bakken, and Eagle Ford. The largest shale plays in terms of recoverable gas are the Marcellus (410.3 trillion cubic feet, 55% of the total), Haynesville, and Barnett. Marcellus – mainly comprised of natural gas also called “dry gas” which is mostly methane (heat our homes and power plant) Utica – may have more “wet gas” with liquids such as ethane, propane, and butane used as a chemical feedstock or additives in gasoline, with low natural gas prices more valuable. The market for ethane has gotten a lot of attention, as Shell weighs building a petrochemical plant in Beaver County that would convert “crack” ethane into ethylene, which is used to make plastics
Hydraulic Fracturing: Drilling Commercial hydraulic fracturing began in 1949, though it took several decades for it to become cost effective Practical application of horizontal drilling to oil production began in the early 1980s in the Barnett Shale in Texas By 2005 the Barnett Shale was producing approximately 0.5 tcf of natural gas per year An initial wellbore is drilled and thick steel pipe is placed in the hole and sealed with cement on the outside of the pipe. Drilling recommences to the deeper zones of interest and when this depth is reached, a second string of steel pipe is run inside the first and additional cement is used to provide a permanent seal.
Hydraulic Fracturing: Land Use Leasing and royalty payments Spacing is variable Marcellus wells can be spaced in 40-acre units or 16 wells per square mile. An average town could contain up to 1,500 wells.
Hydraulic Fracturing: Fracking • Once the well is drilled, hydraulic fracturing also called “fracing” involves injecting between 1-8 million gallons of water, sand, and chemicals down the well. • Chemicals can vary by well. They are often described as soap and oil by the industry. Chlorine is often used as an antibacterial agent. • Frac tickets • The pressurized mixture causes the shale to crack or fracture. • The fissures are held open by the sand to allow gas to flow up the well
Hydraulic Fracturing About ½ the water will stay in the ground and in some cases the water has been reused The rest will come back up as “flowback” or “produced water” or wastewater The wastewater will often be stored in a lined pit onsite until it can be transported to an injection well or containment vessel Wells are then shut in, or capped, while awaiting completion of pipelines to transport the natural gas to market.
Drilling Tower and Capped Well Marcellus Shale horizontal drilling tower in Lycoming County, PA.
Major Holders of Utica Shale Right in Ohio (April 2012) Major Holders of Utica Shale Right in Ohio (April 2012)
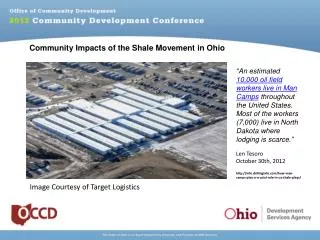
Impact on the Local Community • Noise associated with construction and drilling (for about a month). Compressor stations can also be noisy • Trucking – If one well requires 2 million gallons of water for one fracking, that’s 366 tanker trucks hauling fresh water and 183 tanker trucks hauling wastewater, for a total of 549 tanker truck trips per well. • Increases road use and deterioration • Increased traffic for local residents which can also lead to increased traffic accidents requiring a higher level of local services • Large shale booms like Williston, ND also have population booms putting a strain on housing, utilities, local schools, and other public services • Stresses the importance of agreements with the industry on road maintenance and ensuring severence taxes are appropriate to account for all of these costs
Environmental Impact A bridge to more environmentally friendly energy production Carbon benefits may be slightly less due to the trucking requirements, but carbon emissions remain significantly less than coal
Environmental Impact • In December 2011, the EPA found hydraulic fracturing fluids were responsible for drinking water contamination in Wyoming. • Water use and wastewater • Hydraulic fracturing was exempted from the Safe Drinking Water Act in the Energy Policy Act of 2005 • Gasland – mainly focuses on Dimock, PA but also CO, WY, UT, TX where residents experienced health problems related to contaminated drinking water though it received heavy criticism about baseline testing • Duke University study found elevated levels of methane in water near drilling sites (Osborn et al., 2011)
Environmental Impact • Energy industry focuses on a “few bad apples” (or complete denial of risk, depending on source) and nothing new here – just drilling. • Environmentalists focus on fracking when they should be focused on drilling (casing failures and spills), but there’s nothing new there • Unknown chemicals • In Ohio and PA now release chemicals – frac tickets • Occam’s Razor • Earthquakes from drilling and injection wells • Arkansas, Oklahoma, Texas • Injection well in Youngstown, OH Dec. 2011
Perspective on Environmental Impact • Coal ash spill – • In 2008, the New York Times reported that experts called the Tennessee ash flood that dumped over 1.1 billion gallons of coal ash waste “one of the largest environmental disasters of its kind” • 2011 Coal ash spill in Lake Michigan
Economic Impact We are concerned that job numbers may be overinflated by an industry (any industry). Commenting on shale energy development, Aubrey McClendon CEO of Chesapeake Energy of Oklahoma was quoted in the Columbus Dispatch saying, “This will be the biggest thing in the state of Ohio since the plow.” Industry funded estimates range from 65,000 to 200,000 jobs created by shale development in Ohio Examining the trends in employment we find the jobs impact of shale development will be approximately 20,000 after accounting for the multiplier effect.
Why the Difference? • We can draw upon the experiences and lessons learned from other states like Pennsylvania to create counterfactuals. • Compare drilling counties with similar non-drilling counties in PA. • Statistical regressions on the entire state of Pennsylvania • Trends in direct oil and gas employment • ‘Impact studies’ that estimate direct and indirect effects are over-estimates of new job creation and serious regional economists have not viewed them as best practice for decades. • At best, a well done impact study should tell you how many jobs are ‘supported’ by an industry, not how many jobs it ‘created.’ • At worst, the economic effects can be double counted and unrealistic assumptions applied to the model to increase estimates. • NOT COUNTERFACTUALS!
Economic Theory • The modest impact on jobs is not surprising • More capital intensive than labor intensive • Displacement effects – coal industry, tourism, bid up wages, ‘Dutch Disease’ • Even with impressive growth rates, the energy sector is still a small share of the total Ohio economy at 5.35 million in Feb. 2012 (U.S. BLS) at approximately 0.3% • We do find a significant income effect (leasing and royalty payments, higher wages) • Housing – immediately increase demand for hotels and rental units increasing housing costs • Economists have 150 years of evidence on natural resource booms and the evidence is often negative – “natural resource curse”
Conclusions • Shale natural gas is associated with significant income effects but modest employment effects. • However, the real question of shale investment is not job creation, but net benefits vs. costs (including environmental costs). • In this question, natural gas should be compared to coal, the true alternative. • Shale natural gas is lower cost, less carbon, and like coal has local pollution impacts. Shale natural gas will also reduce natural gas imports. • Ohio should consider higher severance tax to counteract some of these costs and pay for long-term benefits. • Schools, infrastructure, environment. • Invest in assets to account for the lost extracted assets
Thank You Amanda Weinstein Research Associate for the Swank Program in Rural-Urban Policy Dept. Agricultural, Environmental & Development Economics The Ohio State University (weinstein.74@osu.edu)