Download
1 / 38
380 likes | 487 Vues
Kyoto Univ. , KEK A , RIKEN B , CNS Univ. of Tokyo C , ICEPP Univ. of Tokyo D , Tohoku Univ. E

E N D
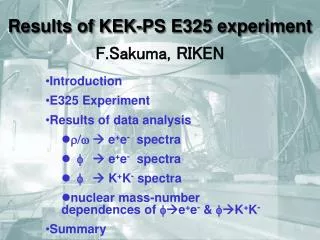
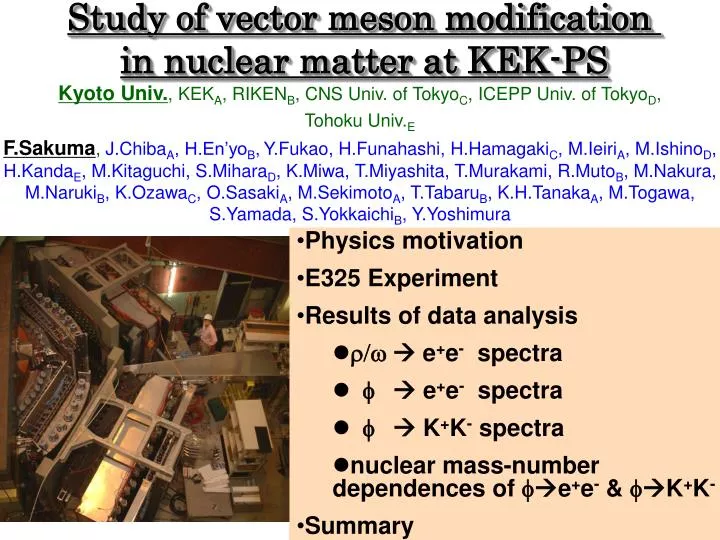
Kyoto Univ., KEKA, RIKENB, CNS Univ. of TokyoC, ICEPP Univ. of TokyoD, Tohoku Univ.E F.Sakuma, J.ChibaA, H.En’yoB,Y.Fukao, H.Funahashi, H.HamagakiC, M.IeiriA, M.IshinoD, H.KandaE, M.Kitaguchi, S.MiharaD, K.Miwa, T.Miyashita, T.Murakami, R.MutoB, M.Nakura, M.NarukiB, K.OzawaC, O.SasakiA, M.SekimotoA, T.TabaruB, K.H.TanakaA, M.Togawa, S.Yamada, S.YokkaichiB, Y.Yoshimura Study of vector meson modification in nuclear matter at KEK-PS • Physics motivation • E325 Experiment • Results of data analysis • r/w e+e- spectra • f e+e- spectra • f K+K- spectra • nuclear mass-number dependences of fe+e- & fK+K- • Summary
Physics Motivation Quark Mass chiral symmetry restoration effective mass in QCD vacuum mu≒md≒300MeV/c2 ms≒500MeV/c2 bare mass mu≒md≒5MeV/c2 ms≒150MeV/c2 chiral symmetry braking How we can detect such a quark mass change? at very high temperature or density, the chiral symmetry is expected to restore W.Weise NPA553,59 (1993) even at normal nuclear density, the chiral symmetry is expected to restore partially
Vector Meson Modification dropping mass • Brown & Rho (’91) m*/m=0.8 (r=r0) • Hatsuda & Lee (’92) m*/m=1-0.16r/r0 for r/w m*/m=1-0.03r/r0 for f • Muroya, Nakamura & Nonaka (’03) Lattice Calc. width broadening • Klingl, Kaiser & Weise (’97&98) 1GeV> for r, 45MeV for f (r=r0) • Oset & Ramos (’01) 22MeV for f (r=r0) • Cabrera & Vicente (’03) 33MeV for f (r=r0)
Vector Meson, r/w/f r/w meson • mass decreases 16% 130MeV/c2 • large production cross-section • cannot distinguish r & w f meson • mass decreases 2~4% 20-40MeV/c2 • small production cross-section • narrow decay width (G=4.3MeV/c2), no other resonance nearby ⇒sensitive to the mass spectrum change T.Hatsuda, S.H.Lee, Phys. Rev. C46(1992)R34.
Expected Invariant Mass Spectra in e+e- bglab~1 e e e p p r/w/f r/w/f e outside decay inside decay • small FSI in e+e- decay channel • double peak (or tail-like) structure + m*/m=1-0.16r/r0 • second peak is made by inside-nucleus decay w f m*/m=1-0.02r/r0 r • depends on the nuclear size & meson velocity • enhanced for larger nuclei & slower meson
Vector Meson Measurements Hot / Cold • CERES@CERN-SPS (’93) • e+e- • anomaly at lower region of r in A+A, not in p+A • STAR@BNL-RHIC (’04) • rp+p- • mass shift in p+p & A+A peripheral • CBELSA/TAPS@ELSA (’05) • wp0g(ggg) • anomaly in g+Nb, not in g+p • NA60@CERN-SPS (’06) • rm+m- • width broadening, no mass shift in In+In CERES TAPS
KEK-PS E325 Experiment • History of E325 • ’93 proposed • ’96 construction start • NIM, A457, 581 (2001). • NIM, A516, 390 (2004). • ’97 first K+K- data • ’98 first e+e- data • PRL, 86, 5019 (2001). • ’99~’02 • x100 statistics in e+e- • PRL, 96, 092301 (2006). • nucl-ex/0511019 • nucl-ex/0603013 x10 statistics in K+K- • nucl-ex/0606029 • ’02 completed Measurements Invariant Mass ofe+e-, K+K- in 12GeV p+Ar,w,f+X reactions slowly moving vector mesons (plab~2GeV/c) large probability to decay inside a nucleus Beam Primary proton beam (~109/spill/1.8s) Target Very thin targets e.g. 0.4% radiation length & 0.2% interaction length for C-target
Detector Setup Forward LG Calorimeter Start Timing Counter Hodoscope Rear LG Calorimeter Aerogel Cherenkov Side LG Calorimeter Forward TOF Barrel Drift Chamber B 0.81Tm Cylindrical DC Rear Gas Cherenkov Vertex DC Front Gas Cherenkov M.Sekimoto et al., NIM, A516, 390 (2004). 1m 12GeV proton beam
Observed Invariant Mass Spectra C Cu w(783) w(783) counts/10MeV/c2 counts/10MeV/c2 e+e- f(1020) f(1020) C Cu f(1020) f(1020) counts/4MeV/c2 counts/4MeV/c2 K+K- K+K- threshold
Result of r/we+e- M.Naruki et al., PRL, 96, 092301 (2006).
e+e- Invariant Mass Spectra counts/10MeV/c2 • from 2002 run data (~70% of total data) • C & Cu targets • acceptance uncorrected • M<0.2GeV/c2 is suppressed by the detector acceptance C w(783) f(1020) fit the spectra with known sources
Fitting with known sources • resonance • r/w/fe+e-, wp0e+e-, hge+e- • relativistic Breit-Wigner shape (with internal radiative corrections) • nuclear cascade code JAM gives momentum distributions • experimental effects are estimated through the Geant4 simulation (multiple scattering, energy loss, external bremsstrahlung, chamber resolution, detector acceptance, etc.) • background • combinatorial background obtained by the event mixing method • fit parameter • relative abundance of these components is determined by the fitting estimated spectrum using GEANT4 fe+e- experimental effects + internal radiative correction relativistic Breit-Wigner
Fitting Results Cu C c2/dof=159/140 c2/dof=150/140 the excess over the known hadronic sources on the low mass side of w peak has been observed. the region 0.60-0.76GeV/c2 is excluded from the fit, because the fit including this region results in failure at 99.9% C.L..
Fitting Results (BG subtracted) events[/10MeV/c2] events[/10MeV/c2] Cu C r/w ratios are consistent with zero ! r/w = 0.0±0.03(stat.)±0.09(sys.) 0.0±0.04(stat.)±0.21(sys.) r/w=1.0±0.2 in former experiment (p+p, 1974) the origin of the excess is modified r mesons
Toy Model Calculation e e p r/w Cu C r=4.1fm r=2.3fm • pole mass: m*/m = 1-kr/r0 (Hatsuda-Lee formula) • generated at surface of incident hemisphere of target nucleus • aw~2/3 [nucl-ex/0603013] • decay inside a nucleus: • nuclear density distribution : Woods-Saxon • mass spectrum: relativistic Breit-Wigner Shape • no width modification
Fitting Results by the Toy Model m*/m = 1 - 0.092r/r0 r/w = 0.7±0.1 r/w = 0.9±0.2 Cu C the excesses for C and Cu are well reproduced by the model including the mass modification.
Result of fe+e- R.Muto et al., nucl-ex/0511019
fe+e- Invariant Mass Spectra • from 2001 & 2002 run data • C & Cu targets • acceptance uncorrected • fit with • simulated mass shape of f (evaluated as same as r/w) • polynomial curve background f(1020) examine the mass shape as a function of bg (=p/m) (anomaly could be enhanced for slowly moving mesons)
Fitting Results 1.75<bg (Fast) bg<1.25 (Slow) 1.25<bg<1.75 Small Nucleus Large Nucleus Rejected at 99% confidence level
Amount of Excess A significant enhancement is seen in the Cu data, in bg<1.25 the excess is attributed to the f mesons which decay inside a nucleus and are modified To evaluate the amount the excess Nexcess, fit again excluding the excess region (0.95~1.01GeV/c2) and integrate the excess area. excluded from the fitting
Toy Model Calculation p f Toy model like r/w case, except for • pole mass: m*/m = 1-k1r/r0(Hatsuda-Lee formula) • width broadening: G*/G = 1+k2r/r0 (no theoretical basis) • e+e- branching ratio is not changed G*e+e-/G*tot=Ge+e-/Gtot • uniformly generated in target nucleus • af~1 [nucl-ex/0603013] • decay inside a nucleus (for bg<1.25): to increase the decay probability in a nucleus
Fitting Results by the Toy Model m*/m = 1 - 0.04r/r0, G*/G = 1 + 2r/r0 1.75<bg (Fast) bg<1.25 (Slow) 1.25<bg<1.75 Small Nucleus Large Nucleus well reproduce the data, even slow/Cu
Result of fK+K- F.Sakuma et al., nucl-ex/0606029
fK+K- Invariant Mass Spectra C • from 2001 run data • C & Cu targets • acceptance uncorrected • fit with • simulated mass shape of f (evaluated as same as r/w) • combinatorial background obtained by the event mixing method counts/4MeV/c2 f(1020) examine the mass shape as a function of bg
Fitting Results 2.2<bg (Fast) bg<1.7 (Slow) 1.7<bg<2.2 Small Nucleus Large Nucleus Mass-spectrum changes are NOT statistically significant However, impossible to compare fe+e- with fK+K-, directly
Kinematical Distributions of observed f • the detector acceptance is different between e+e- and K+K- • very limited statistics for fK+K- in bg<1.25 where the modification is observed in fe+e- the histograms for fK+K- are scaled by a factor ~3
Result of nuclear mass-number dependences offe+e- & fK+K- F.Sakuma et al., nucl-ex/0606029
Vector Meson, f • mass decreases 2~4% 20-40MeV/c2 • narrow decay width (G=4.3MeV/c2) ⇒ sensitive to the mass spectrum change • small decay Q value (QK+K-=32MeV/c2) • ⇒ the branching ratio is • sensitive to f or K modification f mass K+K- threshold simple example • f mass decreases GfK+K- becomes small • K mass decreases GfK+K- becomes large r0:normal nuclear density f : T.Hatsuda, S.H.Lee, Phys. Rev. C46(1992)R34. K : H.Fujii, T.Tatsumi, PTPS 120(1995)289.
GfK+K-/Gfe+e- and Nuclear Mass-Number Dependence a • GfK+K-/Gfe+e- increases in a nucleus NfK+K- /Nfe+e- becomes large • The lager modification is expected in the larger nucleus (A1>A2) • afK+K- becomes larger than afe+e- • The difference of a is expected to be enhanced in slowly moving f mesons
- Da= e+e- K+K- ae+e- with corrected for the K+K- acceptance possible modification of the decay widths is discussed = Results of Nuclear Mass-Number Dependence a bg rapidity pT bg averaged (0.13+/-0.12) afK+K- and afe+e- are consistent
Discussion onGfK+K- and Gfe+e- • The values of expected Da are obtained by the MC. • f mesons are uniformly produced in a nucleus and decayed according to the values of kK and ke. • The measured Da provides constraints on kK and ke.
Discussion onGfK+K- and Gfe+e- kK=2.1+/-1.2+/-2.0 (C&Cu) • The constraint on kK is obtained from the K+K- spectra. • In the K+K- spectra, we fit again excluding the region 0.987(=2mk) ~ 1.01GeV/c2. • We obtain a surplus over the f peak and BG. • From the MC, we estimate the ratio of the number of f mesons decayed inside to outside Nin/Nout (inside = the half-density radius of the Woods-Saxon dist.). • When the surpluses are assumed as the f-meson decayed inside a nucleus, we obtain the constraint on kK by comparing Nsurplus/Nf with Nin/Nout. Cu Cu excluded from the fitting ~ Nsurplus/Nf MC Nin/Nout surplus data kK Nsurplus/Nf = 0.044+/-0.037+/-0.058 (C) 0.076+/-0.025+/-0.043 (Cu)
Discussion onGfK+K- and Gfe+e- • Limits on the in-medium decay widths are obtained. • We renormalize the PDF eliminating an unphysical region corresponding to G*/G<0, and obtain the 90% confidence limits. the first experimental limits assigned to the in-medium broadening of the partial decay widths
Summary • KEK PS-E325 measured e+e- and K+K- invariant mass distributions in 12GeV p+A reactions. • The significant excesses at the low-mass side of we+e- and fe+e- peak have been observed. • These excesses are well reproduced by the toy model calculations which take Hatsuda-Lee prediction into account. • Mass spectrum changes are not statistically significant in the K+K- invariant mass distributions. • Our statistics in the K+K- decay mode are very limited in the bg region in which we see the excess in the e+e- mode. • The observed nuclear mass-number dependences of fe+e- and fK+K- are consistent. • We have obtained limits on the in-medium decay width broadenings for both the fe+e- and fK+K- decay channels.
Contours for r/w and k • C and Cu data are simultaneously fitted. • free parameters • production ratio r/w • shift parameter k • Best-Fit values are k = 0.092±0.002 r/w = 0.7±0.1 (C) 0.9±0.2 (Cu) mass of r/w meson decreases by 9% at normal nuclear density.
Contours for k1 and k2 of fe+e- Pole Mass Shift M*/M = 1–k1r/r0 Width Broadening G*/G = 1+k2r/r0 • C and Cu data are simultaneously fitted. • free parameters • parameter k1 & k2 • Best-Fit values are k1 = 0.034 ± 0.007 k2 = 2.6 ±1.3
values of mean & RMS for each bin Acceptance Correction for a bg bg extrapolate afe+e- for the kaon acceptance assumption : afe+e- is linearly dependent on the y-pT plane in our detector acceptance divide e+e- data into 3x3 bins in the y-pT plane fit the data with the linear function bg slice