Download
1 / 21
220 likes | 529 Vues
Exponential Growth Functions. How do we graph exponential growth functions?. M2 Unit 5a: Day 5. Exponential Growth Function: . Example: Graph the function. 5. 1. 1. Draw a smooth curve from left to right just above the x-axis that moves up and to the right. 1.

E N D
Exponential Growth Functions How do we graph exponential growth functions? M2 Unit 5a: Day 5
Example:Graph the function 5 1 1 Draw a smooth curve from left to right just above the x-axis that moves up and to the right. 1 We will call functions like this “parent functions” because they haven’t been translated
Translations in Exponential Functions…. • h moves the function to the right or left • k moves the function up or down Example: The graph of is translated up 3 units. What is the equation of the translation? Example: The graph of is translated left 2 units and down 5 units. What is the equation of the translation?
You Try: The graph of is translated left 3 units and down 1 unit. What is the equation of the translation?
Asymptotes and y-intercepts y-intercept: To find the y-intercept, plug in zero for x. In an exponential growth function, your y-intercept is alwaysawhen your function is in the form • Asymptote: • a line that a graph approaches more and more closely. Exponential functions have a horizontal asymptote at y=k when your function is in the form .
Example: What are the asymptote and y-intercept for the function on the left? Since this is a “parent function”, it’s asymptote is y = 0. The y-intercept is always a in a “parent function”, so the y-intercept is 1.
Domain and Range The domain of an exponential function will always be ALL REAL NUMBERS The range of an exponential function will depend on where the asymptote is
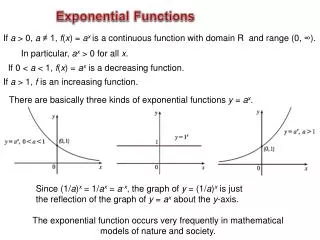
Example: Graph y = 3x. Analyze the graph. 1/3 3 1 1 1 The DOMAIN is all real numbers and the RANGE is y > 0 “Parent functions” of exponential growth function have a horizontal asymptote at y = 0.
Example: Graph . Find the asymptote, domain, and range. Start by sketching the graph of . This is the “parent function”. 6 2 Then, translate the graph __________ 2 units and __________ 2 units. right down This graph has an asymptote at the line ______________. The domain is ____________ and the range is ________________. y = -2 All Real #s y > -2
You Try: Graph the function . Find the asymptote, domain, and range. 1/24 3/2 1/4 The DOMAIN is all real numbers and the RANGE is y > 0 “Parent functions” have a horizontal asymptote at y = 0.
Reflections of Exponential Functions Sometimes, you may see an exponential growth function in which a<0. When this occurs, the graph is reflected over the x-axis. Example: Graph -1/4 -1 -4 Down 3 -3 ¼ -4 -7
End Behavior • After you graph your function, decide what it is doing as x goes to -∞(to the left)and ∞(to the right) • Ex: Describe the end behavior
a. As x - ∞, f(x) 0; as x ∞, f(x) - ∞ b. As x - ∞, f(x) 0; as x ∞, f(x) ∞ c. As x - ∞, f(x) ∞; as x ∞, f(x) 0 d. As x - ∞, f(x) - ∞; as x ∞, f(x) ∞ Describe the end behavior of the following graph.
average rate of change Average Rate of Change – the “slope” The most steep part of the graph has the highest rate of change (ROC)
ROC Where would the rate of change be highest for this function: • Between -6 and -4 • Between -4 and -2 • Between -2 and 0 • Between 0 and 2
ROC Where would the rate of change be highest for this function: • Between 6 and 8 • Between 4 and 6 • Between 2 and 4 • Between 0 and 2
Graph • Asymptote: • Y-intercept: • Domain: • Range: • Describe the translation: • Describe the End Behavior: y = 1 2 All Real #s y > 1 Right 1, Up 1 As x - ∞, f(x) 1; as x ∞, f(x) ∞
Graph and analyze the function. Asymptote: Y-intercept: Domain: Range: Describe the translation: Describe the End Behavior: As x - ∞, f(x) ___; as x ∞, f(x) __
Graph and analyze the function. Asymptote Y-intercept Domain: Range: Describe the translation: Describe the End Behavior: As x - ∞, f(x) ___; as x ∞, f(x) __
HW: pg 122 #1-3 On pg. 122#5, 7 and pg 123 #1, 2, 4 Graph each function Describe the translation Find the asymptote Find the y-int Find the domain and range Describe the end behavior As x - ∞, f(x) ___; as x ∞, f(x) __