Download
1 / 47
470 likes | 614 Vues
Overview of WRAP Regional Haze Modeling Activities. WRAP Regional Modeling Center (RMC) University of California at Riverside Presented at: September 18, 2002 WESTAR Technical Conference Snowbird, Utah. RMC goals and staff Models and Initial Model Scenarios

E N D
Overview of WRAP Regional Haze Modeling Activities WRAP Regional Modeling Center (RMC) University of California at Riverside Presented at: September 18, 2002 WESTAR Technical Conference Snowbird, Utah
RMC goals and staff Models and Initial Model Scenarios Training and Technology Transfer Outline
WRAP RMC Goals • Provide annual modeling of regional haze to support development of Section 309 and 308 SIPs and TIPs. • Improve accuracy of key model inputs. • Capacity Building - Provide applied training in use of models. • Technology transfer of models and datasets to States/Tribes. • Project Timeline: January 2001 to December 2002
RMC Modeling Goals • Section 309 SIPs/TIPs. • Compare REMSAD and Models-3/CMAQ. • Select a model for annual simulations. • Complete model runs for 1996 Base Case, 2018 Base Case and 6 emissions control scenarios. • Due date: 309 models originally targeted for 1/02 • Provide Training and Transfer datasets and models to States/Tribes.
RMC Modeling Goals • Section 308 SIPs/TIPs • Improved Emissions Inventories. • Evaluate Meteorology and Met processing. • Test New Aerosol Formation Mechanisms. • Updated Gas Phase Chemistry (RACM or SAPRC). • Finer Resolution Nested Domains.
Dr. Gail Tonnesen - Project Manager AQ Modeling, Training, and Tech Transfer. Dr. Zion Wang Met Processing and AQ Modeling Dr. Mohammad Omary Emissions Modeling & Processing Dr. Chao-Jung Chien Aerosol Modeling Mr. Mark Chitjian, Mr. Bo Wang NH3 Emissions, Model Analysis Dr. James M. Lents, Nick Nikkila SIPs and TIPs Training Principal RMC Staff at UCR
Ralph Morris REMSAD, Model Comparison, SIP Development Chris Emery Meteorological Modeling, REMSAD, CMAQ Gerald Mansell REMSAD, MM5, CMAQ. Gary Wilson Emissions Modeling and Emissions Processing RMC Staff at ENVIRON Provides technical support/training in REMSAD, Emissions and Meteorological Modeling, Analysis and Development of Model Scenarios.
WRAP Forums provide control scenarios MCNC helping to process emissions and create input files for emission scenarios. Other Participants A variety of consultants and state/local agencies contribute in producing the raw emission inventories
REMSAD and CMAQ Comparison completed in January, 2002. CMAQ was selected for subsequent modeling of emissions reduction strategies. Model Evaluation and Model Selection for Section 309
Year 1996 Scenarios Base Case with actual 1996 wildfires (completed 1/02) Base Case with typical year fire (completed 6/02). Initial Year 2018 Scenarios (with typical year fire) Base Case Command and Control (C&C) C&C w/ Uncertainty Milestone (Annex) No On-road Mobile Emissions No Road Dusts CMAQ Simulations
Introduction to modeling class in collaboration with ITEP. Four training seminars in SMOKE and CMAQ at UCR: 1 week training includes CMAQ and SMOKE. 54 participants Training Seminars
List-serv is used for all WRAP RMC mail: https://pah.cert.ucr.edu/mailman/listinfo/wrap-modeling-forum Discussion Board for https://pah.cert.ucr.edu/wrap/ Phone support is desirable but too resource intensive. On-line Support
Clean boundary conditions and initial conditions using EPA defaults with some updates. CMAQ Domain
Domain: 85 columns, 95 rows, 18 layers, 36km grid cells horizontally 68 variables, Lambert-Conformal Projection Emissions: Area, Mobile, Point (Mexico), Biogenics Point, Road Dust, Fire Meteorology: From EPA MM5 1996 simulation, processed with MCIP v.1 Chemistry: CB-IV with extensions SO2 oxidation into sulfate aerosol VOC oxidation into secondary organic aerosol Coupled with RADM aqueous chemistry CMAQ Description
SMOKE is used for emissions processing. Ported SMOKE to Linux Quality Assurance: SMOKE QA reports Post processing to total emissions subcategories for all layers and all hours. Emissions Processing
IMPROVE database: Raw Dataset Analysis period: Year 1996 total of 104 days available ambient data Raw: ~53 stations Evaluation species SO4, NO3, Bext, PM2.5, PM10, OC, EC Evaluation Overview
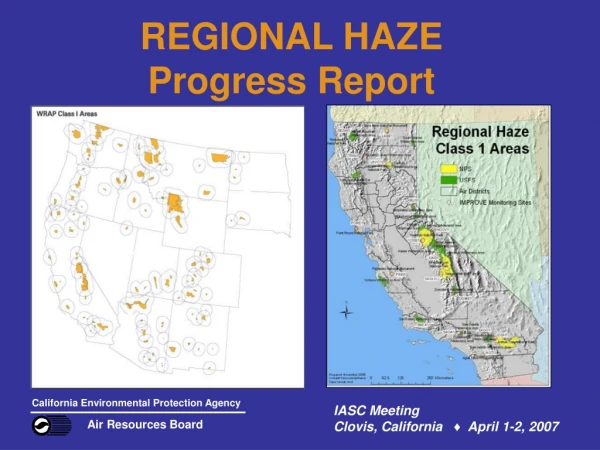
with 1996 IMPROVE Data No 1996 IMPROVE Data IMPROVE & Protocol Sites for Evaluation
with 1996 CASTNET Data No 1996 CASTNET Data CASTNET Sites for Evaluation
Analysis procedures: Compute daily averaged model level-one concentration. Extract species information & concentration from IMPROVE datasets Identify monitoring sites within model domains (convert lat/lon into grid cell) Match model predictions with IMPROVE datasets Generate scatter plots and time-series plots of model results vs. IMPROVE datasets. Modeling Evaluation Procedure
Time series data Scatter plots All Site and All Days All Site for One Day All Days for One Site All Days for Defined Sub-regions Statistical analysis Regression (r-squared) Mean normalized bias (MNB) and error (MNE) Results from Analysis Program(complete results at: www.cert.ucr.edu/rmc)
Annual Time-Series Plots – SO4 Bryce Canyon, UT Grand Canyon, AZ
Annual Time-Series Plots – NO3 Bryce Canyon, UT Grand Canyon, AZ
Annual Time-Series Plots – OC Bryce Canyon, UT Grand Canyon, AZ
Annual Time-Series Plots – EC Bryce Canyon, UT Grand Canyon, AZ
Annual Time-Series Plots – SOIL Bryce Canyon, UT Grand Canyon, AZ
PM2.5 mass composition at Grand Canyon Nat’l Park, AZ - Summer
PM2.5 mass composition at Grand Canyon Nat’l Park, AZ - Winter
EPA inverse modeling showed strong seasonality in NH3 emissions: We reduced winter NH3 emissions by 50% This reduced the NO3 over prediction to be consistent with other species. Still need to explore winter vertical mixing. Western BC were too high Reduced western BC based on IMPROVE data at clean western sites. Sensitivity Runs
Added typical year wildfire, prescribed and Agricultural burning emissions. Revised road dust model. Reduced winter NH3 by 50 percent These revised inputs were used in the 2018 modeling and in a revised 1996 simulation for the progress comparison. Emissions Inventory Updates
Model over predicts most species in the winter. Model performance is best in summer. Model does not get the peaks on the correct day: Precedent from SAMI longterm regional O3 model Should consider “unpaired in time & space” evaluation. Coarse mass is under predicted Missing windblown dust emissions inventory. Conclusions for 1996 Model Performance Evaluation
Year 1996 Simulations Used Base Case for 1996 performance evaluation. Used Base Case with typical fires for control strategy comparison. Year 2018 Simulations 2018 Base Case C&C C&C w/ Uncertainty Milestone No Mobile Emissions (On-Road only) No Road Dust Initial Model Simulations
Average model prediction for worst 20% measured days for: the 6 Colorado Plateau IMPROVE sites with 1996 data. the 20 non-California IMPROVE sites with 1996 data. Relative Reduction Factor: ratio of 2018 model/1996_model used to scale 1996 observations Other plots available at project website. Presentation of Results
If base case model performance is inadequate, future simulations may be scaled by the error in the 1996 base case simulation. Relative Reduction Factor (RRF) is calculated as the ratio of 1996_data/1996_model Plots will be shown either as absolute model predictions or scaled by RRF. Relative Reduction Factor
Fig 1. 2018 Response to Controls for Colorado Plateau for worst 20% of ambient data.
Fig 2. 2018 Response to Controls for Transport Region for worst 20% of ambient days
Class I areas on the Colorado Plateau Best 20%: Improvements in 9 out of 16 Areas (56%) Worst 20%: Improvements in 12 out of 16 Areas (75%) Other Class I Areas in 9-State Region (Less CA) Best 20%: Improvements in 24 out of 40 Areas (60%) Worst 20%: Improvements in 29 out of 40 Areas (73%) California Class I Areas Best 20%: Improvements in 17 out of 29 Areas (57%) Worst 20%: Improvements in 23 out of 29 Areas (79%) Summary of Projected Future-Year Changesin Visibility from 1996 to 2018
Class I areas on the Colorado Plateau Best 20%: The same or better in all 16 Class I Areas Worst 20%: The same or better in 15 out of 16 Class I Areas (exception is Petrified Forest) Other Class I Areas in 9-State Region (Less CA) Best 20%: The same or better in 39 of 40 Class I Areas (exception is Chiricahua Wilderness) Worst 20%: The same or better in 39 of 40 Class I Areas (exception is Eagles Nest Wilderness) California Class I Areas Best and Worst 20%: The same or better in all 29 Areas Summary of Visibility Benefits of 2018 SO2 Annex Milestone vs. Command and Control w/ Uncertainty
SO2 Emission Differences 2018 SO2 Annex Milestone vs. Command & Control w/ Uncertainty
Annex/milestone visibility improvement is better than C&C w/uncertainty. Improvements from SOx control strategies are small for the CO Plateau sites. Model worst days are not the same as the measured worst days. Possible that the model may show a larger response if we do “unpaired in time” analysis. Need to improve model inputs and model performance before we rely on “unpaired in time” model results. Conclusions
Regional Haze Rule (RHR) Section 309 Requirements: Determine whether emissions from Mobile Sources or Road Dust contribute “significantly” to visibility impairment at any of the 16 Class I areas on the Colorado Plateau If either Mobile Sources or Road Dust are found to contribute “significantly”, then: Mobile Sources: emissions budgets and tracking system must be established Road Dust: “necessary and appropriate emissions management strategies” must be implemented Visibility Significance Calculation
Preliminary Mobile Source Sensitivity for 2018 Need to redo adding Non-Road Sources and limit to just 9-state transport region For just On-Road Mobile, Bext ranges from 3.6% to 8.1% (proposed threshold Bext < 10%) Adding Non-Road sources will likely exceed 10% Preliminary Road Dust Sensitivity for 2018 Missing wind blown dust, so used absolute modeling results No Road Dust change in extinction ranges from 0.8% to 3.1% at 16 Class I Areas Mobile Source and Road Dust Significance using Proposed Cumulative Significance Threshold
2018 Regional (9-state GCVTC region) Mobile Emissions Significance Test for the 16 GCVTC Class I Areas. (Modeling completed – in processing) 2018 Mobile Emissions Significance Test for the 16 GCVTC Class I Areas for: California, Phoenix, and Las Vegas. (Modeling completed – in processing) Evaluation of Visibility Impacts of 2018 Prescribed Fired Control Strategy Options (Optimal Smoke Management, Base Smoke Management) (Awaiting needed input data) Additional Modeling Scenarios
Stationary Source (Market Trading Forum) PM and NOx Sensitivity Evaluation, to estimate the impact of potential NOx and PM reductions on visibility for 309 (d)(4)(v). Market Trading Forum is required to assess the need for a backup trading program(s) to keep these pollutants at their lowest levels for >100 tpy sources in the GCVTC 9-state region. (Preprocessing data) Additional Modeling Scenarios (cont)
2018 All Control Strategies Combined – Projection of Visibility Improvement. (Not yet started) Anticipate known modeling scenarios will be completed by end of calendar year 2002 Additional Modeling Scenarios (cont)