Download
1 / 26
260 likes | 408 Vues
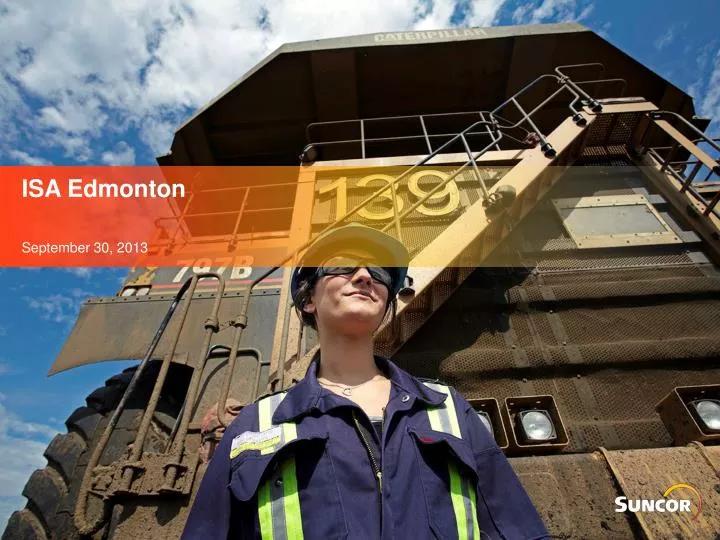
ISA Edmonton. September 30, 2013. Canada’s leading integrated energy company. Focused on profitable growth and returning cash to shareholders. The Suncor Advantage Largest reserves in the oil sands (1) Integrated model maximizes the value of production – capturing ±95 % of world price (2)

E N D
ISA Edmonton September 30, 2013
Canada’s leading integrated energy company Focused on profitable growth and returning cash to shareholders The Suncor Advantage • Largest reserves in the oil sands(1) • Integrated model maximizes the value of production – capturing ±95% of world price(2) • Capital discipline • 2013 dividend increase of 54% - 5 year CAGR of 30% • $2B share buyback extension • $7.3B capex program expected to be funded from cash flow from operations • Strong balance sheet • Operational excellence • Oil Sands cash operating costs trending below $35/bbl(4) • Reliability improving – targeting 90%+ facilities utilization • Profitable growth plan • Near term higher return oil sands debottleneck projects • Longer term offshore, in situ replication, PFT mines • Sustainable development • Aggressive goals for water usage, land reclamation, air emissions and energy intensity Over 34 years of production at current rates (3) Proved plus Probable Reserves Contingent Resources (1) Source: Sproule Canadian Oil & Gas Reserves 2011 Chart (2) Based on Suncor’s crude oil and liquids production volumes for the 12 months ended March 31, 2013. (3) Assumes that all 6.9 billion boe of proved and probable reserves are produced at a rate of 549,100 boe per day, Suncor’s 2012 production rate. In relation to contingent resources, the numbers provided are gross and a best estimate.
Suncor’s operations Upstream, mid-stream and downstream
Profitable portfolio of oil producing assets Growing oil sands business with complementary upstream & downstream operations Circles are scaled to relative capacities.
Suncor – Petro-Canada Merger Merger Date: August 1, 2009 Suncor Pre-merger: • Fort McMurray operations – Mining, extraction, upgrading, In-situ • 2 refineries – Sarnia, Commerce City (Denver) • Pipeline operations • Ontario retail network - Sunoco • Renewable fuels – wind, ethanol Petro-Canada Pre-merger: • 2 refineries (Edmonton, Montreal) and Lubricants (Mississauga) • International Upstream assets – East Coast, North Sea, North Africa • National Retail & Wholesale networks – Petro-Canada • Natural Gas assets
Refining & Marketing—optimizing the oil sands barrelIndustry Leading Performance R&M Net Earnings (1)(US dollars per barrel of capacity) Edmonton Refinery (140 kb/d)- 100% oil sands integration-35 kb/d heavy feedstock Sarnia Refinery (85 kb/d)- approximately 75% synthetic crude oil Montreal Refinery (137 kb/d)- potential to convert to 100% inland crude diet Denver (98 kb/d)- up to 15 kb/d sour synthetic in addition to local crudes Mississauga Lubricants Plant (24 kb/d)- Montreal and offshore feedstock # Suncor(# rank among peers(2)) 20 Top quartile 1 Median of peers 1 Bottom quartile 15 1 1 1 1 10 2 3 5 1 2 1 1 4 0 -5 Q3 Q4 Q1 Q2 Q3 Q4 Q1 Q2 Q3 Q4 Q1 Q2 Q3 Q4 2009 2010 2011 2012
Edmonton Refinery Overview • 140,000 bpd Crude Capacity • Sour & Sweet Synthetic, Bitumen • Primary Products • Gasoline & Diesel • 247 hectares - operating area covers approximately 193 hectares including tankage • 491 employees – about 2/3 are CEP unionized 8
RefineryFast Facts Refinery has been on site since 1951 • Original 10 kbpd plant constructed by British American Oil Co. – total cost $8M • Refinery upgraded by Gulf in 1971 – 80 kbpd at a cost of $80M • 46 kbpd Syncrude processing units added in 1981 – $275M • Facilities to remove sulfur from gasoline and diesel added in 2004 and 2006 at a cost of $1,400M Gulf Canada rebuild in early 1970’s was to take advantage of IPL/APPL product pipelines across Western Canada and allow consolidation of refining to Edmonton area Up to 250 regular contractors to support refinery operation Major construction project 2006 – 2008 RCP (Refinery Conversion Project) to change crude feedstock to be 100% Alberta bitumen based • Construction manpower peaked at over 7,000 people per day • RCP capital investment totaled $2,700 M Total Project Investment of $4.1 B over the 2002 – 2008 period 9
Since 2004 Significant Changes at Edmonton Pre RCP Operation Post RCP Operation 60% Conventional 35% Sour Syncrude Gasoline Gasoline Edmonton Refinery Edmonton Refinery 25% Bitumen Distillate Distillate 40% Sweet Syncrude 40% Sweet Syncrude Refinery Conversion Project (RCP), started up in November 2008, completed the conversion of Edmonton Refinery to 100% Oil Sands- based crude
Post-RCP Challenges • 18 months of operational challenges following late-2008 startup • Operational Improvements made as a result of: • Ongoing investments • Operational familiarity • Additional Training • Operational Discipline • Re-design and re-work • Achievements recognized with the refinery being the recipient of the Suncor President’s Operational Excellence (POEA) award in November 2012
Sustainability and Suncor Environmental performance goals and collaboration Industry Leadership • Co-founded Oil Sands Leadership Initiative (OSLI) in 2009 • Co-founded Oil Sands Tailings Consortium (OSTC) in 2010 • Co-founded Canada’s Oil Sands Innovation Alliance (COSIA) in 2012 • Co-founded Oil Sands Developers Group (OSDG) in 2000 • Co-founded Cumulative Environmental Monitoring Association (CEMA) in 2003 External Verification • A constituent of the Dow Jones Sustainability Index for 12 consecutive years • A member of the FTSE4Good Index since 2001. • Suncor is listed on the CDP’s “Carbon Disclosure Leadership Index” • Ceres member company since 2010 Indicator Environmental performance goal Reduce fresh water consumption by 12% by 2015 Water Increase reclamation of disturbed land area by 100% by 2015 Land Energyefficiency Improve energy efficiency by 10% by 2015 Airemissions Reduce air emissions by 10% by 2015
Wind Power • 12 years experience developing wind projects; • Our first wind project (Sunbridge) has been in operation for 11 years; • 6 wind power projects totaling 255 MW; • 492,500 Tonnes CO2/yr avoided; • Most recent project- 6th wind farm 88 MW Wintering Hills, near Drumheller, AB
Ethanol • Canada’s largest ethanol plant – Mooretown, ON; • 1 million bushels of corn per year; • ~ 80% of the corn is sourced from Canada • Ethanol production; 400 million litres/year; • Co-products; 270,000 metric tons per year; • 100% of the ethanol produced is used in Petro-Canada gasoline
Gold Bar Recycled Water Line • Since 2005 Suncor (originally a Petro-Canada project) has used up to 15 ML/day of treated, recycled municipal wastewater as boiler feedwater and for use in hydrogen production. • This innovative project required the construction of advanced ultrafiltration membrane technology at the EPCOR Gold Bar Waste Water Treatment facility and a 5.5 km pipeline to deliver the water to the refinery • This project created a cost-effective and timely solution to the refinery’s need for additional water without requiring additional facilities to be constructed to withdraw additonal water from the North Saskatchewan River. • This project received numerous awards including an Emerald award for Environmental Excellence in 2007
ISO 14001 Environmental Focus Sustainability and Environmental performance is key and Edmonton Refinery’s Environmental Management System is ISO14001 registered Continual Improvement • Flaring reduction • Spill reduction • Focus on Loss of Containment events • Waste reduction • Water use reduction • EpcorGoldbar recycled water • Sour water strippers • Discharge to municipal wastewater treatment plant • Disposal well discharge reduction • Stakeholder relations Pollution Prevention • Emissions management (SO2, NOx, GHG) Regulatory Compliance • Reduce impact of upsets • Flaring Opacity • Releases • Odors 18
Quality Management Systeml • ISO 9001:2008 Certified • Internationally Recognized Standard • Focuses on Product Quality and Continual Improvement • Refinery Processes Audited Regularly • By Registrar • By Suncor • By Third Party Contractor • By Environment Canada
Edmonton Refinery Economic Impacts • One of the largest taxpayers in Strathcona County • Significant annual expenditures on Maintenance and Capital Investments • Maintenance Turnaround activities require 1000+ contract tradespersons for 4 – 5 weeks, occurring almost annually • Over 600 fuel trucks loaded per day to distribute fuel across Alberta and to northern Canada locations • Current top hourly wage rate is over $51.00/hr. (approx. $107,000 annually). Latest agreement provides increases of 3.25%, 3.5% and 3.75% over the 2013 – 2015 period
Community Investment - Suncor Energy Foundation • Since its inception in 1998, the Suncor Energy Foundation has invested more than $84 million in charitable organizations across Canada • In June of 2012, $500,000 was donated to the Edmonton Jerry Forbes Centre for Community Spirit through the Suncor Energy Foundation • $1.5 million was pledged to the Southern Alberta flood relief program in July 2013
Value-Added in Canada • Suncor has made significant investments in our three Canadian refineries in recent years which provided thousands of jobs in local refining communities and across the country. • Hundreds of millions of dollars to meet environmental regulations including low sulphur gasoline and diesel and reduction of benzene in gasoline. • Hundreds of millions of dollars annually to improve the ongoing safety and reliability of our operations. • Billions of dollars to improve competitiveness - principally at Edmonton (140 KBPD crude capacity) and Sarnia (85 KBPD crude capacity).
Suncor employment and spend in Canada 0 FTE $7.6 million 1832 FTE $1.22 billion 527 FTE $376.6 million 0 FTE $3.1 million 152 FTE $42.8 million 13 FTE $25.2 million 272 FTE $230 million 311 FTE $190.5 million 8673 FTE $7.56 billion 2 FTE $300 thousand 12 FTE $10.3 million 19 FTE $73.7 million FTE – Full Time Equivalent jobs Source: Suncor Supply Chain and Human Resources 2010
Value-Added in Canada • We continue to make investments at our existing facilities to ensure the reliability of our operations and to make incremental gains in production capacity – this process is called debottlenecking • We invest millions of dollars a year in preventative maintenance programs at our facilities to ensure that we can operate safely and reliably. These programs employ hundreds of contractors at each of our sites and are a significant contributor to the local economy • Overall, improving our existing operations and maintaining the competitiveness of our refineries is the priority for our downstream business