Download
1 / 24
240 likes | 413 Vues
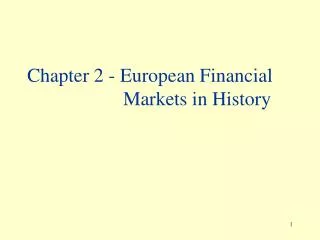
FMC2/MACSI Colloquium. A MEM-based Analysis of Volatility Spillovers in European Financial Markets. Lena Golubovskaja NUI Maynooth. Contents. 1. Introduction. 2. Theoretical Developments. The MEM Models. 3. Empirical Results. 4. Analysis of Volatility.

E N D
FMC2/MACSI Colloquium A MEM-based Analysis of Volatility Spillovers in European Financial Markets Lena Golubovskaja NUI Maynooth
Contents 1 Introduction 2 Theoretical Developments The MEM Models 3 Empirical Results 4
Analysis of Volatility • Financial volatility has been extensively investigated for more than twenty-five years • Financial integration => cross-country transmission mechanisms • Strong empirical regularities about GARCH models
Channels of Financial Contagion Source: Árvai, Driessen, and Ötker-Robe (2009)
Chou, Wu, and Yung (2010) The relationships between the U.S. and European Stock Price Ranges ? B: Pre-subprime, 2001/02 – 2007/06 C: Post-subprime 2007/07 – 2010/01 A: Entire Period
Hypothesis Whether volatility spillover effect exist between the European markets? 1 Do we have a symmetric or assymetric volatility mechanism among the markets? 2 Who is the main volatility transmitter during the subprime mortgage crisis? 3
Why Multiplicative Error Models? • Modelling non-negative time series • A lot of information available in financial markets is positive valued: ultra-high frequency data (within a time interval: range, volume, number of trades, number of buys/sells, durations) daily volatility estimators (realized volatility, daily range, absolute returns) • Time series exhibit persistence: GARCH–type models
Germany: Daily Range, 1991-2011 Autocorrelation 0.737
Range-based Volatility Parkinson (1980) showed that that the range is an unbiased estimator of the volatility parameter in a diffusion process. The intuition behind his finding is that the price range of intraday gives more information regarding the future volatility than two arbitrary points in this series (the closing prices).
Are These Days the Same? Can we use this information to measure volatility better?
Volatility Proxy • The daily range • Theoretical relative efficiency gain 2.5-5 (Parkinson, 1980) • Directly observable from the data • It is well approximated as Gaussian • Robust to the microstructure noise (Brandt and Diebold, 2006)
MEM • Extension of GARCH approach to modelling the expected value of processes with positive support (Engle, 2002; Engle and Gallo, 2006) • Autoregressive Conditional Duration is a special case • Ease of estimation • Possibility of expanding the information set
The Base Model Assumptions • a non-negative univariate process • the information about the process up to time t-1 • MEM for is specified as • is a nonnegative predictable process, depending on a vector of unknown parameters θ • is a conditionally stochastic i.i.d. process, with density having non-negative support, mean 1 and unknown variance
A Gamma Assumption for With and =>
Range Density France The Netherlands
The specification of • Base(1,1) specification • Extended specification - the return of stock i at time t-1. - a dummy variable to test the leverage effect.
Estimation • The contribution of to the log likelihood function is
Gamma GED • A useful relationship is between the Gamma distribution and the Generalized Error Distribution (GED): • Thus the conditional density of hlthas a correspondence in a conditional density of hlt where
Estimation Results t-stats
Forecasting Performance France Germany Netherlands Spain
Summing Up • We find evidence of dependence across European markets over full sample and over post-subprime • MEM is a flexible class of models to estimate conditional expectations of non-negative processes • Captures a wide range of features suggested by data structure • Challenge: handle a large panel of data