Download
1 / 39
390 likes | 463 Vues
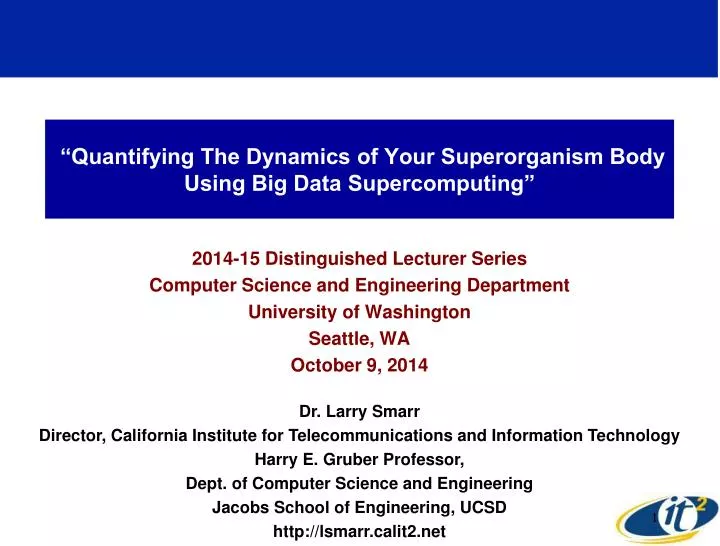
“Quantifying The Dynamics of Your Superorganism Body Using Big Data Supercomputing”. 2014-15 Distinguished Lecturer Series Computer Science and Engineering Department University of Washington Seattle, WA October 9, 2014. Dr. Larry Smarr

E N D
“Quantifying The Dynamics of Your Superorganism Body Using Big Data Supercomputing” 2014-15 Distinguished Lecturer Series Computer Science and Engineering Department University of Washington Seattle, WA October 9, 2014 Dr. Larry Smarr Director, California Institute for Telecommunications and Information Technology Harry E. Gruber Professor, Dept. of Computer Science and Engineering Jacobs School of Engineering, UCSD http://lsmarr.calit2.net
Abstract As a member of Lee Hood's 100 Person Wellness Project, headquartered in Seattle's Institute for System Biology, I am engaged in experiments to read out the time varying state of a complex dynamical system - my human body. However, the human body is host to 100 trillion microorganisms, ten times the number of cells in the human body, and these microbes contain 100 times the number of DNA genes that our human DNA does. The microbial component of this "superorganism" is comprised of hundreds of species spread over many taxonomic phyla. The human immune system is tightly coupled with this microbial ecology and in cases of autoimmune disease, both the immune system and the microbial ecology can have dynamic excursions far from normal. To provide a deeper context for the microbiome results from the 100 Person Wellness Project, I have been exploring the variation in the microbiome ecology across healthy and chronically ill populations. Our research starts with trillions of DNA bases, produced by Illumina Next Generation sequencers, of the human gut microbial DNA taken from my own body over time, as well as from hundreds of people sequenced under the NIH Human Microbiome Project. To decode the details of the microbial ecology we feed this data into parallel supercomputers, running sophisticated bioinformatics software pipelines. We then use Calit2/SDSC designed Big Data PCs to manage the data and drive innovative scalable visualization systems to examine the complexities of the changing human gut microbial ecology in health and disease. I will show how advanced data analytics tools find patterns in the resulting microbial distribution data that suggest new hypotheses for clinical application.
Calit2 Has Had a Vision of “the Digital Transformation of Health” for a Decade • Next Step—Putting You On-Line! • Wireless Internet Transmission • Key Metabolic and Physical Variables • Model -- Dozens of Processors and 60 Sensors / Actuators Inside of our Cars • Post-Genomic Individualized Medicine • Combine • Genetic Code • Body Data Flow • Use Powerful AI Data Mining Techniques www.bodymedia.com The Content of This Slide from 2001 Larry Smarr Calit2 Talk on Digitally Enabled Genomic Medicine
By Measuring the State of My Body and “Tuning” ItUsing Nutrition and Exercise, I Became Healthier My Decade Long Journey to Being a Quantified Self: I Arrived in La Jolla in 2000 After 20 Years in the Midwest Age 61 Age 41 Age 51 1999 2010 2000 1999 1989 I Reversed My Body’s Decline By Quantifying and Altering Nutrition, Exercise, Sleep, and Stress http://lsmarr.calit2.net/repository/LS_reading_recommendations_FiRe_2011.pdf
From One to a Billion Data Points Defining Me:The Exponential Rise in Body Data in Just One Decade Microbial Genome Billion: My Full DNA, MRI/CT Images Improving Body SNPs Million: My DNA SNPs, Zeo, FitBit Discovering Disease Blood Variables One: My Weight Hundred: My Blood Variables Weight
Early Adopting MDs Are Creating Partnerships with Their Quantified Patients Will Grow to 1000, then 10,000 There are 8760 Hours in a Year One of These Hours You Are With a Doctor… The Other 8759 Hours Are Up to You! • “The 100 participants will be guided on this 9-month journey by a coach and when necessary, be referred to their own health care practitioners.” • The data sets that will be evaluated include: • Self-Tracking Devices • Medical History, Traits, Lifestyle • Blood, Urine, Saliva • Gut Microbiome • Whole Genome Sequencing https://pioneer100.systemsbiology.net/
Visualizing Time Series of 150 LS Blood and Stool Variables, Each Over 5-10 Years Calit2 64 megapixel VROOM
Only One of My Blood Measurements Was Far Out of Range--Indicating Chronic Inflammation 27x Upper Limit Episodic Peaks in Inflammation Followed by Spontaneous Drops Normal Range <1 mg/L Normal Complex Reactive Protein (CRP) is a Blood Biomarker for Detecting Presence of Inflammation
Adding Stool Tests RevealedOscillatory Behavior in an Immune Variable 124x Upper Limit Typical Lactoferrin Value for Active Inflammatory Bowel Disease (IBD) Hypothesis: Lactoferrin Oscillations Coupled to Relative Abundance of Microbes that Require Iron Normal Range <7.3 µg/mL Antibiotics Antibiotics Lactoferrin is a Protein Shed from Neutrophils - An Antibacterial that Sequesters Iron
Confirming the IBD (Crohn’s) Hypothesis:Finding the “Smoking Gun” with MRI Imaging I Obtained the MRI Slices From UCSD Medical Services and Converted to Interactive 3D Working With Calit2 Staff & DeskVOX Software Liver Transverse Colon Small Intestine Descending Colon MRI Jan 2012 Cross Section Diseased Sigmoid Colon Major Kink Sigmoid Colon Threading Iliac Arteries
Why Did I Have an Autoimmune Disease like IBD? Despite decades of research, the etiology of Crohn's disease remains unknown. Its pathogenesis may involve a complex interplay between host genetics, immune dysfunction, and microbial or environmental factors. --The Role of Microbes in Crohn's Disease So I Set Out to Quantify All Three! Paul B. Eckburg & David A. Relman Clin Infect Dis. 44:256-262 (2007)
The Cost of Sequencing a Human GenomeHas Fallen Over 10,000x in the Last Ten Years This Has Enabled Sequencing of Both Human and Microbial Genomes
Inclusion of the Microbiome Will Radically Change Medicine and Wellness Your Body Has 10 Times As Many Microbe Cells As Human Cells 99% of Your DNA Genes Are in Microbe Cells Not Human Cells I Will Focus on the Human Gut Microbiome, Which Contains Hundreds of Microbial Species
When We Think About Biological DiversityWe Typically Think of the Wide Range of Animals But All These Animals Are in One SubPhylum Vertebrata of the Chordata Phylum All images from Wikimedia Commons. Photos are public domain or by Trisha Shears & Richard Bartz
Think of These Phyla of Animals When You Consider the Biodiversity of Microbes Inside You Phylum Chordata Phylum Cnidaria Phylum Annelida Phylum Echinodermata Phylum Mollusca Phylum Arthropoda All images from WikiMedia Commons. Photos are public domain or by Dan Hershman, Michael Linnenbach, Manuae, B_cool
However, The Evolutionary Distance Between Your Gut MicrobesIs Much Greater Than Between All Animals Last Slide Green Circles Are Human Gut Microbes Evolutionary Distance Derived from Comparative Sequencing of 16S or 18S Ribosomal RNA Source: Carl Woese, et al
A Year of Sequencing a Healthy Gut Microbiome Daily -Remarkable Stability with Abrupt Changes Days Genome Biology (2014) David, et al.
To Map Out the Dynamics of My Microbiome Ecology I Partnered with the J. Craig Venter Institute Illumina HiSeq 2000 at JCVI • JCVI Did Metagenomic Sequencing on Seven of My Stool Samples Over 1.5 Years • Sequencing on Illumina HiSeq 2000 • Generates 100bp Reads • Run Takes ~14 Days • My 7 Samples Produced • >200Gbp of Data • JCVI Lab Manager, Genomic Medicine • Manolito Torralba • IRB PI Karen Nelson • President JCVI Manolito Torralba, JCVI Karen Nelson, JCVI
We Expanded Our Healthy Cohort to All Gut Microbiomesfrom NIH HMP For Comparative Analysis Each Sample Has 100-200 Million Illumina Short Reads (100 bases) “Healthy” Individuals IBD Patients 2 Ulcerative Colitis Patients, 6 Points in Time 250 Subjects 1 Point in Time Larry Smarr 7 Points in Time 5 Ileal Crohn’s Patients, 3 Points in Time Total of 27 Billion Reads Or 2.7 Trillion Bases Source: Jerry Sheehan, Calit2 Weizhong Li, Sitao Wu, CRBS, UCSD
We Created a Reference DatabaseOf Known Gut Genomes Now to Align Our 27 Billion Reads Against the Reference Database • NCBI April 2013 • 2471 Complete + 5543 Draft Bacteria & Archaea Genomes • 2399 Complete Virus Genomes • 26 Complete Fungi Genomes • 309 HMP Eukaryote Reference Genomes • Total 10,741 genomes, ~30 GB of sequences Source: Weizhong Li, Sitao Wu, CRBS, UCSD
Computational NextGen Sequencing Pipeline:From “Big Equations” to “Big Data” Computing • PI: (Weizhong Li, CRBS, UCSD): • NIH R01HG005978 (2010-2013, $1.1M)
We Used SDSC’s Gordon Data-Intensive Supercomputer to Analyze a Wide Range of Gut Microbiomes Source: Weizhong Li, Sitao Wu, CRBS, UCSD Our Team Used 25 CPU-Years To Compute the Comparative Gut Microbiome of My Time Samples and Our Healthy and IBD Controls Starting With the 5 Billion Illumina Reads Received from JCVI Enabled by a Grant of Time on Gordon from SDSC Director Mike Norman
We Used Dell’s HPC Cloud to Analyze All of Our Human Gut Microbiomes • Dell’s Sanger Cluster • 32 Nodes, 512 Cores • 48GB RAM per Node • We Processed the Taxonomic Relative Abundance • Used ~35,000 Core-Hours on Dell’s Sanger • Produced Relative Abundance of ~10,000 Bacteria, Archaea, Viruses in ~300 People • ~3Million Spreadsheet Cells • New System: R Bio-Gen System • 48 Nodes, 768 Cores • 128 GB RAM per Node Source: Weizhong Li, UCSD
Using Scalable Visualization Allows Comparison of the Relative Abundance of 200 Microbe Species Comparing 3 LS Time Snapshots (Left) with Healthy, Crohn’s, UC (Right Top to Bottom) Calit2 VROOM-FuturePatient Expedition
Using Microbiome Profiles to Survey 155 Subjects for Unhealthy Candidates
Bacteroidetes and Firmicutes Phyla Dominate“Healthy” Subjects in the Pioneer 100 Gut Microbiomes A Few With High % Proteobacteria or Verrucomicrobia
Lessons from Ecological Dynamics: Gut Microbiome Has Multiple Relatively Stable Equilibria “The Application of Ecological Theory Toward an Understanding of the Human Microbiome,” Elizabeth Costello, Keaton Stagaman, Les Dethlefsen, Brendan Bohannan, David Relman Science 336, 1255-62 (2012)
We Found Major State Shifts in Microbial Ecology PhylaBetween Healthy and Two Forms of IBD Average HE Most Common Microbial Phyla Average LS Average Crohn’s Disease Average Ulcerative Colitis Hybrid of UC and CD High Level of Archaea Collapse of Bacteroidetes Explosion of Actinobacteria Explosion of Proteobacteria
Is the Gut Microbial Ecology Different in Crohn’s Disease Subtypes? Ben Willing, GASTROENTEROLOGY 2010;139:1844 –1854 Colonic Crohn’s Disease (CCD) Ileal Crohn’s Disease (ICD)
PCA Analysis on Species Abundance Across People Green-Healthy Red-CD Purple-UC Blue-LS ICD PCA2 Healthy Subset? CCD PCA1 Analysis by Mehrdad Yazdani, Calit2
KEGG: a Database Resource for Understanding High-Level Functions and Utilities of the Biological System http://www.genome.jp/kegg/
Using Ayasdi To Discover Patternsin KEGG Cellular Pathway Dataset topological data analysis Source: Pek Lum, Chief Data Scientist, Ayasdi Dataset from Larry Smarr Team With 60 Subjects (HE, CD, UC, LS)Each with 10,000 KEGGs - 600,000 Cells
Disease Arises from Perturbed Cellular Networks:Dynamics of a Prion Perturbed Network in Mice Our Next Goal is to Create Such Perturbed Networks in Humans Source: Lee Hood, ISB
Next Step:Compute Genes and Function • Full Processing to Function (COGs, KEGGs) • Would Require • ~1-2 Million • Core-Hours Plus Dedicated Network to Move Data From R Systems / Dell to Calit2@UC San Diego
“A Whole-Cell Computational ModelPredicts Phenotype from Genotype” • A model of Mycoplasma genitalium, • 525 genes • Using 1,900 experimental observations • From 900 studies, • They created the software model, • Which requires 128 computers to run
Early Attempts at Modeling the Systems Biology of the Gut Microbiome and the Human Immune System
Next Step: Time Series of Metagenomic Gut Microbiomes and Immune Variables in an N=100 Clinic Trial Goal: Understand The Coupled Human Immune-Microbiome Dynamics In the Presence of Human Genetic Predispositions Drs. William J. Sandborn, John Chang, & Brigid Boland UCSD School of Medicine, Division of Gastroenterology
From Quantified Self to National-Scale Biomedical Research Projects My Anonymized Human Genome is Available for Download The Quantified Human Initiative is an effort to combine our natural curiosity about self with new research paradigms. Rich datasets of two individuals, Drs. Smarr and Snyder, serve as 21st century personal data prototypes. www.delsaglobal.org www.personalgenomes.org
Thanks to Our Great Team! UCSD Metagenomics Team Weizhong Li Sitao Wu Calit2@UCSD Future Patient Team Jerry Sheehan Tom DeFanti Kevin Patrick Jurgen Schulze Andrew Prudhomme Philip Weber Fred Raab Joe Keefe Ernesto Ramirez JCVI Team Karen Nelson Shibu Yooseph Manolito Torralba SDSC Team Michael Norman Mahidhar Tatineni Robert Sinkovits UCSD Health Sciences Team William J. Sandborn Elisabeth Evans John Chang Brigid Boland David Brenner