Download
1 / 52
570 likes | 729 Vues
Immunological diagnosis. (Institute of Immunology, ZJU). 1. Principles and influencing factors of Ag-Ab reaction. 1) Principles of Ag-Ab reaction a. Specificity Binding between Ab and Ag has very high specificity.

E N D
Immunological diagnosis (Institute of Immunology, ZJU)
1. Principlesand influencing factors of Ag-Ab reaction 1) Principles of Ag-Ab reaction a. Specificity Binding between Ab and Ag has very high specificity. Affinity: the strength of the binding between a single binding site of an Ab and an Ag Avidity: the overall strength of interaction between an Ab and an Ag.
b. reversal combination • noncovalent force • hydrogen bond • electrostatic attraction • Van der Wals forces • hydrophobic bond degree of dissociation • Ag-Ab affinity • Environmental factors
C. Concentration and ratio of Ag and Ab When the antigens and antibodies are present in an appropriate ratio, they form insoluble immune complexes (e.g. aggregation or precipitation) large enough to be seen.
As increasing concentrations of Ag are added to a constant amount of Ab, the amount of IC precipitated rises and then falls. The precipitin curve generated in this way has three zones. Ab excess zone (prozone) equivalence zone Ag excess zone (postzone)
Precipitin curve Immune complex Antibody excess zone
d. Two phases Specific combination Visible phase
2) influencing factors of Ag-Ab reaction • electrolytes • Temperature:37 degree • pH:pH6-8
2 Methods for detection of Ag or Ab A. Agglutination reaction a. Principle When the particle Ags interact with the appropriate Ab, they clump together and eventually form masses that become large enough to be seen. b. Types direct agglutination reaction indirect agglutination reaction
B. Precipitation reaction a. Principle When soluble Ags come in contact with specific Ab, they precipitate. Precipitation can be demonstrated via immunodiffusion in a semisolid medium (e.g. agar). b. Types immunonephelometry: the formation of IC in solution is monitored by spectrometry. single immunodiffusion double immunodiffusion immunoelectrophoresis
C. Complement fixation test • Ag and Ab reactions lead to the formation of IC that activates complement system by classical pathway. • This may be exploited to detect the amount of unknown Ag or Ab.
D. Immuno-labeling techniques a. Principle Specific Abs (or Ags ) labelled with fluorescein, enzymes, colloidial gold or radioisotopes are used as probes for the detection of Ags (or Abs). b. Types
Enzyme immunoassay (EIA) • EIA is to use enzyme-labeled Abs or Ags to detect Ag and Ab interactions. • The enzyme converts a colorless substrate (chromogen) to a colored product. • ELISA: Ag or Ab in solution • Enzyme immunohistochemistry: Ag in tissue
Enzyme linked immunosorbent assay, ELISA • The advantages of ELISA include specificity, sensitivity, rapidity, inexpensiveness, and safety. • Enzyme: horseradish peroxidase, HRP • Substrates: diaminobenzidine (DAB) 3,3’,5,5’-tetramethylbenzidine (TMB)
Methods • Indirect ELISA: Ab measurement • Sandwich ELISA: Ag detection • Competitive ELISA: Ag or Ab detection
6. ELISA to detect Ab (HIV, HCV) to detect Ag to detect Ag
Immunofluorescence • Immunofluorescence assay is to use a fluorescent compound (usually fluorescein) to detect the binding of Ag and Ab. • The Ab is labeled with the fluorescent compound and its presence is revealed using a fluorescence microscope. • Direct, indirect immunofluorescence and indirect complement amplified immunofluorescence
Radioimmunoassay, RIA Chemiluminescence immunoassay, CLIA Immunoblotting, Western blotting Immuno-PCR, IM-PCR Immunologic colloidal gold signature, ICE
B G T R A Absorbent material Gold nanoparticle labeled anti-HCG (mouse IgG) Ag(HCG,human chorionic gonadotropin) mouse anti-HCG (immobilized) Anti-mouse IgG (immobilized)
2. Detection the Function of Immune cells 1) Isolation of immune cells A Isolation of PBMC: Ficoll Urografin density-gradient separation B: Isolation of lymphocytes and subsets. a,immunoabsorbing assay b. immunomagnetic separation c. FACS d. peptide-MHC tetramer technique
Magnetic cell sorting (MACS) • Three basic steps 1) Target cells are labeled with antibody- conjugated magnetic particles. 2) The labeled cells are placed within a magnetic field. 3) The labeled cells are retained in the magnetic field while the unlabeled cells are washed away
Figure A-26 MACS:magnetic cell sorting 1,The target cell are labeled with Ab-conjugated magnetic paticles 2,The labeled cells are placed within a magnetic fields. 3, The labeled cells are retained in the magnetic fields while the unlabeled cells are washed away
FACS separation • The basic principle of FACS is immunofluorescence and therefore flow cytometers can be considered to be specialized fluorescence microscopes. • The modern flow cytometer consists of a light source, collection optics, electronics and a computer to translate signals to data • Isolation of different cell populations by FACS relies on the different expression of surface Ags.
Ag-MHC tetramer technique Fluoresceinated avidin MHC I Biotin MHC I Antigenic peptide
2)Lymphocyte function assays T cell function assay A. Lymphocyte proliferation test Lymphecyte proliferation is usually determined using polyclonal activators of lymphocytes or lymphocyte mitogens. • T cell stimuli are lectins (PHA, Con A). • Morphologic counting 3H-TdR or 125I-UdR incorporation MTT chromatometry B. DTH detection: ‘OT’ test or PPD test
Lymphoblast ( morphological features): • Lymphoblasts are 12-20 µm in diameter with a round to oval nucleus. The periphery of both the nucleus and the cell may be irregularin outline. • The fine, highly dispersed nuclear chromatin stains a light reddish-purple, and one or two pale blue or colorless large nucleoli are visible. The cytoplasm is usually basophilic, with marginal (peripheral) intensity a common characteristic.
2)Lymphocyte function assays B cell function assay A. Detection of Ig B. Ab-forming cell detection
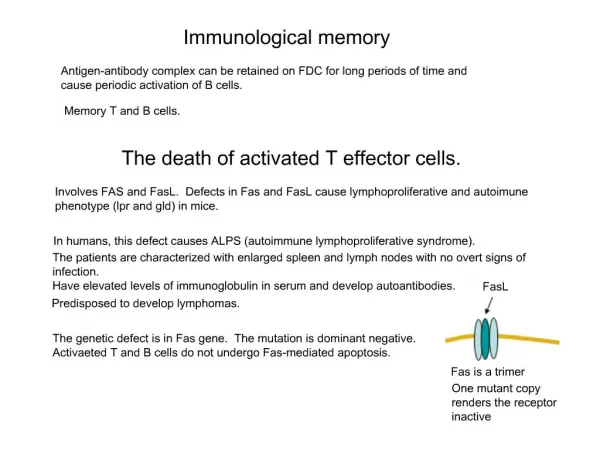
2)Lymphocyte activation assays C. Cytolytic test Assays for CTL in patients can be performed as a variant of a mixed cell culture using the target cells that labelled byradioisotopes. 51Cr releasing LDH cell staining method Apoptosis cell detection
Cytotoxic T-cell activity is often assessed by chromium release from labeled target cells. Target cells are labeled with radioactive chromium as Na251CrO4, washed to remove excess radioactivity and exposed to cytotoxic T cells. Cell destruction is measured by the release of radioactive chromium into the medium, detectable within 4 hours of mixing target cells with T cells.
Fragmented DNA can be labeled by terminal deoxynucleotidyl transferase (TdT) to reveal apoptotic cells. When cells undergo programmed cell death, or apoptosis, their DNA becomes fragmented (left panel). The enzyme TdT is able to add nucleotides to the ends of DNA fragments; most commonly in this assay, biotin-labeled nucleotides (usually dUTP) are added (second panel). The biotinylated DNA can be detected by using streptavidin, which binds to biotin, coupled to enzymes that convert a colorless substrate into a colored insoluble product (third panel). Cells stained in this way can be detected by light microscopy, as shown in the photograph of apoptotic cells (stained red) in the thymic cortex. Photograph courtesy of R. Budd and J. Russell.
D. phagocytic dysfunction E. Cytokine production biological activity immunoassay:ELISA, intracellular CKs, ELISPOT PCR