Download

1 / 75
750 likes | 844 Vues
MRPO Data Analysis Update. National RPO Technical Workgroup Meeting St. Louis, Nov. 4-6, 2003. MRPO Data Analysis Approach. 3-prong attack Workgroup : State analysts and stakeholder members mine AQS data, examine specific issues (narrow focus)

E N D
MRPO Data Analysis Update National RPO Technical Workgroup Meeting St. Louis, Nov. 4-6, 2003
MRPO Data Analysis Approach • 3-prong attack • Workgroup: State analysts and stakeholder members mine AQS data, examine specific issues (narrow focus) • Contractors: Tackle bigger projects and those requiring specialized expertise • In-house: Direct workgroup, develop new projects, focus on projects requiring more complex tools or analysis
Current Workgroup Projects • PM-Coarse: Characterize PM-coarse concentrations across region in terms of annual average, daily peaks, seasonal variation (Sarah Raymond, IDEM) • Continuous Speciation: Analyze continuous NO3, SO4, EC, OC data for diurnal patterns, weekday/weekend differences, EC/OC ratios, correlations with other criteria pollutants (Bill Adamski, WDNR, Sarah Raymond, IDEM) • PM2.5-O3 Relationship: Time series analysis of PM2.5 and O3 to explore how closely these 2 pollutants are linked (Mike Rizzo, R5 EPA)
Current Workgroup Projects (cont’d) • Indicator species: Examine O3 dependence on NOx and VOC with MAPPER (Bill Adamski, WDNR) • Monthly-Annual Averages: Develop regression model to predict annual average PM from selected monthly averages (Mike Lebeis, DTE) • Ion balance: Determine if aerosol is neutral, acidic, or basic (Joyce Gentry, MOG)
Contractor Projects • Review of Optical Data (ARS) • Analysis of Aircraft Data (Sonoma Tech) • Seney OC Speciation (Jamie Schauer) • Indicator Species, O3/Nox-VOC dependence, and sensitivity of PM to SO4 and NO3 reductions with ISORROPIA and SCAPE2 thermodynamic models (Charlie Blanchard) • Analysis of Recent Haze Data (Betty Pun, AER) • Source Apportionment of IMPROVE Data (DRI/Battelle) • Phase 1: SA of Eastern and Midwestern IMPROVE sites using PMF and UNMIX. Joint MRPO/Marama project, Battelle, completed 2002 • Phase 2: In-depth analysis of 4 sites using PMF, UNMIX, CMB, more species, more trajectory analysis. Focus on 2o sources, especially OC. DRI draft report 9/03.
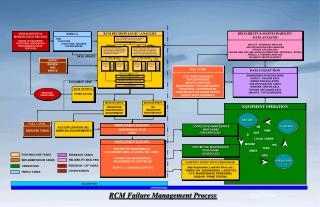
In-House MRPO Projects • GIS: Quantification of transboundary transport by back trajectory analysis • CART: Classification and regression tree analysis for PM forecasting and ozone ‘representativeness’ study • Spatial characterization of PM2.5 in urban areas • Ammonia data review
State-by-State Contributions to Class 1 Areas Avg. PM2.5 is the average PM2.5 concentration associated with the endpoints in each state of trajectories that originate at the indicated Class 1 area. Percent mass is calculated as
St. Louis Supersite Continuation of St. Louis Supersite (cofunding by EPA) through June 2004. Comprehensive suite of measurements including criteria gases; continuous SO4, EC/OC, NO3, met; 1/6 day PM10, PM2.5, speciated PM2.5.
Organic Carbon Speciation at Seney • Organic carbon makes up about one-third of PM2.5 mass at Seney NWR. • OC on monthly composited filters analyzed for markers of various sources of organic carbon (gasoline- and diesel-fueled vehicles, wood burning, meat cooking, other combustion) • Source apportionment will examine relative importance of anthropogenic and biogenic sources to visibility impairment in this scenic wilderness • Isotope analysis on select species Seney National Wildlife Refuge, one of two Class 1 areas in Midwest RPO
Nitrogen Speciation at Bondville, IL • Continuous (15-minute) measurements of particle nitrate, particle sulfate, ammonium, and gaseous nitric acid, sulfur dioxide, nitrous acid, and ammonia • Operating in central, rural Illinois in agricultural area • Supplemented with denuder measurements, IMPROVE, meteorology, photolytic NO2, ozone • Will support thermodynamic models of particle formation and help determine when conditions for particle formation are limited by nitric acid and ammonia. Particle humidification and collection chamber
New Monitoring Projects • Rural ammonia monitoring (with CENRAP) • 1/6 day denuder sampling at 8 sites for one year • Continuous ammonia at Bondville, plus 1 ‘roving’ monitor • Intercomparison of denuder, IC, and photoacoustic NH3 measurements • Denuder measurements include HNO3, SO2, particle NO3, SO4, and NH4
Equipment installation completed and sampling started Oct. 2003
New Monitoring Projects (cont’d) • Urban organic speciation • 1/6 day or more frequent sampling and analysis at 3 urban sites (Indianapolis, Detroit, Cincinnati) and 1 rural site (Bondville) • Includes drum sampling • Source apportionment of organic species will quantify contribution of vehicles, diesels, and wood-burning to urban and rural OC
Goals • For both total mass and individual components of PM2.5: • Summarize annual average concentrations and show sites relative to each other; characterize background, upwind, central, and downwind sites. • In the same way, summarize seasonal variations • Determine whether an ‘urban excess’ exists, what species contribute to it, and whether it varies seasonally
Data Available • FRM data from 1999-2002 (note that most sites do not meet completeness criteria in early years) • 12 sites total in metro area • Only POC 1 data used • Speciation data from 2001-2003 • 5 sites, 2 shut down and 3 currently operating • Reconstructed mass calculating using IMPROVE algorithm • IMPROVE data for Bondville IL and Livonia IN were averaged for 2001-2002 to represent regional background concentrations. • Note slightly different analytical methods for OC/EC
Preliminary Conclusions—FRM Analysis • PM2.5 mass concentrations increase on a gradient from SW to NE through downtown Detroit, then decrease moving away from the city. All sites between Luna Pier (farthest upwind) and Linwood are above the NAAQS. • An ‘outer ring’ of suburban sites (Ann Arbor, Ypsilanti, Oak Park) have lower concentrations, just below the NAAQS. • Dearborn is the highest site, in keeping with its highly industrial location. • All FRM sites exhibit the same seasonal pattern of winter and summer peaks, spring and fall lows. Seasonal differences are generally only about 2 ug/m3. • Year-to-year changes are quite small (about 1 ug) and the relative differences among sites remain the same over the three years of data
Preliminary Conclusions—Speciation Data • Organic carbon makes up the biggest fraction of PM2.5 in Detroit (36%), followed closely by sulfate (31%) and nitrate (23%). EC and soil are 4% and 5%, respectively. • Organic carbon, elemental carbon, and soil show the largest changes from site to site. • Each species shows the same SW-NE gradient changes in concentration as does total PM2.5, increasing as you approach the center city, peaking at Dearborn, and decreasing as you move away from the city. • Dearborn has uncharacteristically high soil (2.5x other sites, unusual for PM2.5) and also significantly more OC than other sites
Preliminary Conclusions—Speciation Data • Strong seasonal behavior by sulfate (summer peak) and nitrate (winter peak). • Moderate seasonality (summer peak) by OC. • EC and soil show little seasonality. • Use caution comparing IMPROVE data with STN data, especially carbon (but this analysis is based on multiyear averages so differences have less effect)
Urban Excess • Annually, urban area contributes no sulfate, 1.6 ug/m3 nitrate, and 4.9 ug/m3 of OC to PM2.5, above regional background concentrations • Seasonally, the excess varies with the mass of the component, except for sulfate and soil. • OC excess is higher in summer and winter, nitrate excess is higher in winter, EC exhibits little seasonal difference • Sulfate excess is actually negative in the summer when sulfate is highest (i.e., the city is acting as a sink for sulfate). Likewise, soil excess is also negative in summer when soil is typically higher than other seasons.