Download
1 / 16
160 likes | 287 Vues
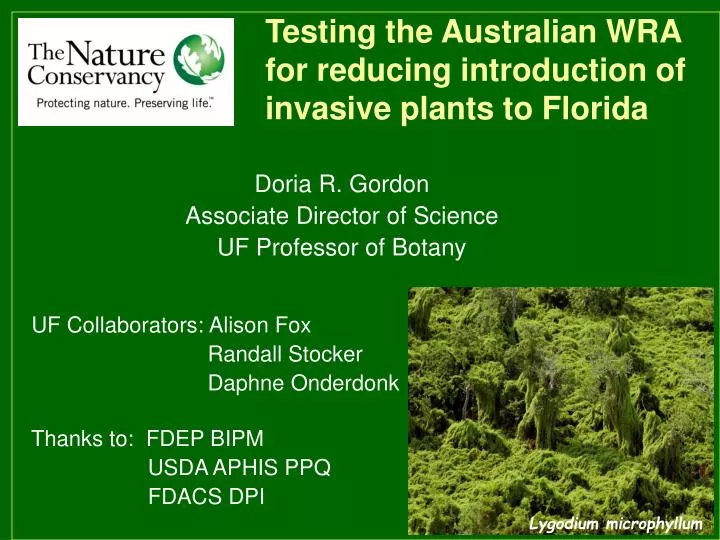
Testing the Australian WRA for reducing introduction of invasive plants to Florida. Doria R. Gordon Associate Director of Science UF Professor of Botany UF Collaborators: Alison Fox Randall Stocker Daphne Onderdonk Thanks to: FDEP BIPM

E N D
Testing the Australian WRA for reducing introduction of invasive plants to Florida Doria R. Gordon Associate Director of Science UF Professor of Botany UF Collaborators: Alison Fox Randall Stocker Daphne Onderdonk Thanks to: FDEP BIPM USDA APHIS PPQ FDACS DPI Lygodium microphyllum
Outline • Why test a predictive tool in Florida? • Our approach • Modified Australian Weed Risk Assessment • Data used • Results • Comparison to tests elsewhere • Accuracy • ROC • Conclusions Imperata cylindrica
Why a predictive tool for Florida? 57% of plant shipments, carrying 74% of all plants imported to the U.S., enter through Florida (2006) Number of Plants Imported through Miami International Airport
Hypothesis • Accuracy in FL will be comparable to that for Australia, HI, and other geographies • > 90% of invaders correctly identified • > 75% of non-invaders correctly identified • < 15% of species require further evaluation
Florida Test • Australian WRA with minor modifications to 3questions for greater relevance to Florida’s climate • Include Daehler et al. (2004) secondary screen for species requiring further evaluation
Species List • 158 non-native species in Florida • 62 major invaders • 31 invasive in natural areas(IFAS Assessment - Fox et al. 2005) • 31 invasive in agricultural areas(SWSS lists) • 48 minor invaders • Documented in Florida’s flora but not as invasive • 48 non-invasive – after > 50 years in FL • Documented in cultivation but not in any flora • Invaders and non-invaders paired by family and life form as possible • Assessor had no knowledge of original category or species distribution in Florida
Species breakdown Life form Non-invaderMinor InvaderMajor invader Forb/herbaceous 12 18 23 Graminoid 3 8 8 Shrub 10 5 8 Subshrub 1 2 1 Vine 7 8 9 Tree 15 7 13 Phylogeny Families 35 27 36 Orders 24 14 25 21% overlap across Families 59% overlap across Orders
Results • Sufficient data for all 158 species – 35 questions answered on average • Natural area = agricultural weeds • Scores not biased by plant family • 4 question decision tree (Caley & Kuhnert 2006) correct for 100% of major invaders & 12% of non-invaders • 91% of minor invaders rejected • “Invader elsewhere?” correct for 92% of major invaders & 92% of non-invaders • 67% of minor invaders rejected
Non-invader Minor invader Major invader Results Evaluate Further Accept Reject
Results • 27% of species (42) in Evaluate Further category • 10% of species (16) in Evaluate Further after using secondary screen (meets hypothesized < 15%)
Ardisia crenata Results • Using secondary screen • No percentages significantly different than hypothesized
Receiver Operating Characteristic Curve Minor and Major Invaders Combined • Curve area = 0.91 • Area not significantly different than when Minor and Non-invaders are combined (0.89) • When Score = 3: • 90% correct rejects • 70% correct accepts
Comparison to tests elsewhere • 82 - 100% Major Invaders rejected - NS • 56 - 87% • Non-invaders accepted • CR > AU, HI, BI • H & P > AU, HI • 22 - 80% • Minor invaders rejected • BI > AU, CR • 13 – 29% • *8 – 11% • Eval further * * Used 2o screen (Daehler et al. 2004) * * * *
ROC Curves – Minor + Non 8 7 CR area > all others Pheloung et al. 1999 Křivánek & Pyšek2006 Kato et al. 2006 10 8
ROC Curves –Minor + Major All curve areas equivalent Pheloung et al. 1999 Daehler & Carino 2000 Křivánek & Pyšek 2006 Kato et al. 2006 5 5 9 6 5
Conclusions • The WRA amended for conditions in Florida and with the secondary screen developed by Daehler et al. (2004) meets the three hypothesized accuracy standards: • > 90% of invaders correctly rejected • > 75% of non-invaders correctly accepted • < 15% of species require further evaluation • Results not significantly affected by: • Natural areas vs. agricultural weeds • Families, life-form, life-history • The WRA approach appears useful across variable geographies. Solanum viarum