Download
1 / 20
200 likes | 267 Vues
Directions to 2050. A New International Framework The scale of the challenge Post Copenhagen Architecture Sector based agreements Enabling large scale action A global CO 2 market. David Hone Group Climate Change Adviser Shell International B.V. A new direction is needed.

E N D
Directions to 2050 A New International Framework The scale of the challenge Post Copenhagen Architecture Sector based agreements Enabling large scale action A global CO2 market David Hone Group Climate Change Adviser Shell International B.V.
A new directionis needed The way we produce and use energy today is not sustainable
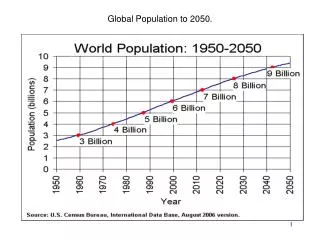
Very demanding reductions are called for • Effective action requires: • Global emissions to fall by at least 50% relative to 1990 by 2050; • Global average per capita emissions that will – as a matter of basic arithmetic – need to be around 2 tonnes (T) by 2050 (20 GT divided by 9 billion people): this figure is so low that there is little scope for any large group to depart significantly above or below it; • Agreement by developed countries to take on immediate and binding national targets of 20% to 40% by 2020, and to commit to reductions of at least 80% by 2050; • Key Elements of a Global Deal • Nicholas Stern
Key Levers in the Economy • CO2 emissions = people GDP energy CO2 • person unit GDP unit energy • Only four factors govern the outcome, being: • Population Number of people • Standard of Living GDP per person • Energy Intensity Energy per unit of GDP (efficiency of the economy) • Carbon Intensity CO2 per unit of energy (reflects the energy source) X X x x x
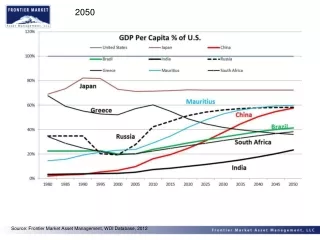
Pathways to 2050 Falling CO2 emissions per unit of energy 2008 2025 2050 Improving energy efficiency 450 400 350 300 Wealthy developed Developed Leading developing Developing 250 Energy per capita, GJ 200 150 100 50 0 $0 $20,000 $40,000 $60,000 GDP per capita, US$ 2000 (ppp)
The prospect of emission targets looms “Developed” countries with Kyoto Targets Singapore Finland Rapidly emerging economies in Asia Taiwan Korea Malaysia Romania China Thailand 350 300 250 200 Energy per Capita, GJ 150 100 50 0 $0 $10,000 $20,000 $30,000 $40,000 GDP per Capita, US$ ppp (2000)
Two pathways to consider Direct recruitment to cadre of nations with targets 2013 - 2020 No target under the Kyoto Protocol Opportunity to respond to the market through the Clean Development Mechanism National emission target 2018 - 2030 2008 - 2012 2013 - 2020 National action agreements National policies and measures Sectoral agreements Funding via market mechanisms Use of clean-technology funds
The global abatement curve Cost of abatement € /tCO e 2 B Abatement GtCO e per year in 2030 2 A C Higher cost technologies still moving down the cost curve Energy efficiency measures, land use practices, avoided deforestation. Large scale abatement within the electricity sector. Some land restoration.
The anatomy of a deal Cost of abatement € /tCO e 2 B D Targeted systems for agriculture and deforestation Abatement GtCO e per year in 2030 2 A C Support for Demonstration programmes globally Large scale action through cap-and-trade, transport measures (vehicle efficiency, low carbon fuels etc.) and building regulations Developed Developing Less Developed Absolute targets National policies and measures: SD-PAMs, NAMAs, without access to international project mechanisms. Large scale action in the electricity (and transport) sector driven by international project mechanisms and clean tech funds. Smaller scale clean development projects utilising the CDM
Important for the CDM to Evolve • Clean Development Mechanism • Existing CDM rolls forward • Smaller scale than CTM • Development agenda • Focus on less developed economies • Clean Technology Mechanism • Focussed on the higher end of the • abatement curve • Principally clean electricity • Recognises CCS • Drives sector-based approach • CDM / JI (Kyoto 2008-2012) • Small / Moderate scale • Development “dividend” • SD criteria • Additionality • Exhaustive project by project process Abatement GtCO e per year in 2030 2 Cost of abatement € /tCO e 2
Possible Post-Copenhagen Architecture Clean Tech Funds Supporting Mechanisms Absolute targets Measurable Reportable Policies & Measures Adaptation Funding Carbon Market Infrastructure Verifiable Long term goal
Possible Post-Copenhagen Architecture Clean Tech Funds Supporting Mechanisms Sector based agreements Sector based agreements Adaptation Funding Carbon Market Infrastructure Shifting the balance towards absolute targets through large scale packages of activity Absolute targets Measurable Reportable Long term goal Policies & Measures Verifiable
Design of a sector based “satellite” agreement • Sector Based • Agreements • Large scale preparatory step towards absolute targets • Clear purpose and end-point • Built on the foundation elements • Negotiated separately (by a limited number of parties) as “satellites” to the main agreement • Typically focussed on a sector • Technology capacity building, funding and financing • Best practice capacity building
Emissions Mitigation Pathways • Only four pathways forward: • Energy efficiency • Renewables • Nuclear • Fossil fuels with Carbon Capture and Storage (CCS) • All four are essential and will be needed at scale: • To meet energy demands this century • To limit CO2 emissions into the atmosphere • CCS is a key focus area in Shell: • A family of technologies all in use today • Large scale end-to-end demonstration needs to happen • Deployment need not be a distant dream
A “sector based” agreement that focuses on coal use in the power sector • EU-ETS • US-ETS First large scale CCS demo projects (e.g. China) CCS Project Mechanism & certification processes finalised CCS Standard emerges in some countries Clean technology funding framework emerges globally Initial CCS roll-out in developing countries Emissions trading adopted in many developing country power sectors $ £ ¥ € Initial CCS infrastructure funded directly 2009 2010-2015 2020 2025+ Funding flow CCS Certs.
Supporting CCS in the international framework • Key elements that need to be present in the near term: • CCS recognised within the UNFCCC Clean Development Mechanism (CDM) or within a new post 2012 mechanism; • International CCS certification, that delivers a (tradable) certificate for one tonne of CO2 stored underground and supports the CDM; • A funding framework for the demonstration phase of CCS, consisting of - • Recognition of CCS within existing and new clean technology funds (e.g. the fund recently proposed by the G8); • Recognition of extra-national CCS demonstration projects within national and regional funding arrangements.
Positioning CCS in the evolution of the CDM • Clean Development Mechanism • Existing CDM rolls forward • Smaller scale than CTM • Development agenda • Focus on less developed economies • Clean Technology Mechanism • Focussed on the higher end of the • abatement curve • Principally clean electricity • Recognises CCS • Drives sector-based approach • CO2 Storage Certificate • Recognises CCS globally • Certifies tonnes sequestered • Standardised rules • Potentially tradable • CDM / JI (Kyoto 2008-2012) • Small / Moderate scale • Development “dividend” • SD criteria • Additionality • Exhaustive project by project process Abatement GtCO e per year in 2030 2 Cost of abatement € /tCO e 2
A Global Carbon Market must evolve New technology mechanisms evolve (e.g. for CCS) China adopts CCS standard CDM evolves to include clean electricity mechanism CDM Linkages develop between all systems and more systems appear Japan technology standards Norwegian ETS Expanding EU-ETS EU-ETS Danish-ETS New Zealand ETS UK-ETS Australian ETS US National or North American “cap-and-trade” 2000 2005 2010 2015 2020 2025 Pre-Kyoto Kyoto Post 2012 Linkage framework