Download
1 / 25
250 likes | 334 Vues
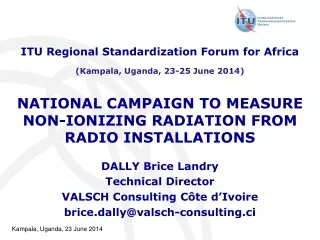
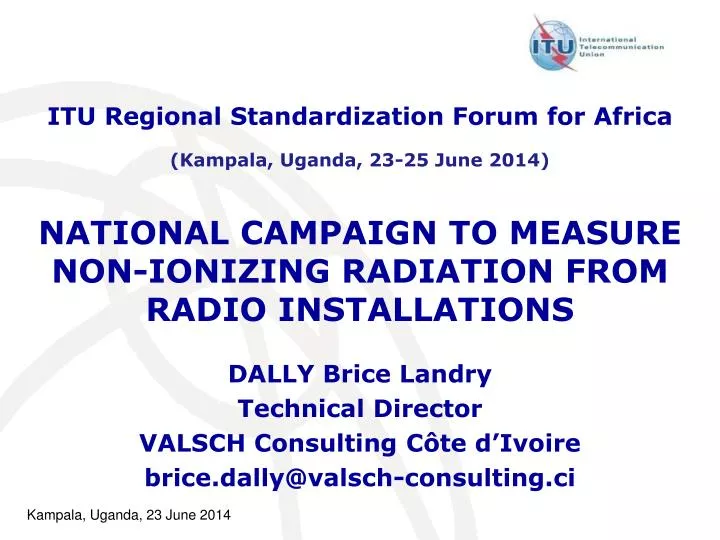
ITU Regional Standardization Forum for Africa (Kampala, Uganda, 23-25 June 2014). NATIONAL CAMPAIGN TO MEASURE NON-IONIZING RADIATION FROM RADIO INSTALLATIONS. DALLY Brice Landry Technical Director VALSCH Consulting Côte d’Ivoire brice.dally@valsch-consulting.ci. CONTENT OF PRESENTATION.

E N D
ITU Regional Standardization Forum for Africa (Kampala, Uganda, 23-25 June 2014) NATIONAL CAMPAIGN TO MEASURE NON-IONIZING RADIATION FROM RADIO INSTALLATIONS DALLY Brice Landry Technical Director VALSCH Consulting Côte d’Ivoire brice.dally@valsch-consulting.ci
CONTENT OF PRESENTATION • CONTEXT • TERMS OF REFERENCE • MISSION OBJECTIVES • SCOPE OF ACTIVITY CONDUCTED • ANTICIPATED DURATION • EXPECTED DELIVERABLES • IMPLEMENTATION AND RESULTS OF MISSION • CONCLUSION AND RECOMMENDATIONS
CONTEXT Within the framework of its control mission and its 2012 activities, ATCI (now restructured to form ARTCI and AIGF pursuant to Decree No. 2012-293 of 21 March 2012 on Telecommunications and Information and Communication Technologies) chose the company VALSCH Consulting to support it in carrying out a National Campaign to Measure Non-Ionizing Radiation from Radio Installations. This presentation provides an overview of the terms of reference of the 2012 measurement campaign and a synthesis of the results obtained.
TERMS OF REFERENCE • MISSION OBJECTIVES • Evaluate the levels of exposure of populations to electromagnetic fields; • Check the compliance of populations’ exposure levels with normative requirements (exposure limits); • Map the field strength levels.
TERMS OF REFERENCE • SCOPE OF ACTIVITY CONDUCTED The mission was dimensioned so as to cover 122 measurement points divided into two (2) groups spread over 22 Côte d’Ivoire communes. GROUP II GROUP I NUMBER OF POINTS NUMBER OF POINTS TOTAL NUMBER OF MEASUREMENT POINTS TOTAL NUMBER OF MEASUREMENT POINTS Table 1: Distribution of measurement points by group and by commune
TERMS OF REFERENCE • DURATION OF MISSION • Eight (08) weeksbroken down as follows: • Six (06) weeks of research in the field; • Two (02) weeks of data processing and analysis. • NORMATIVE REFERENCES • CENELEC standard (EN 50492): Basic standard for the in-situ measurement of electromagneticfieldstrengthrelated to humanexposure in the vicinity of base stations.
TERMS OF REFERENCE Choice of location Analysis of location Global evaluation of exposure Broadband measurement <−3 V/m Detailed evaluation of exposure Result of measurement Choice of location <3 V/m Selective measurement Informative evaluation of field strength levels by service Extrapolation Measurement by service integration Determination of measurement uncertainty Elaboration of measurement report Figure 1: Flowchart of measurement process
TERMS OF REFERENCE • International Council on Non-Ionizing Radiation Protection (ICNIRP) guidelines on exposurelimits for the general public and workers – 1998. Frequencyrange Equivalent plane wavepower densitySeq (W/m2) Table 2: Formula for calculating the reference levels set by ICNIRP
TERMS OF REFERENCE • EXPECTED DELIVERABLES Table 3: Summary of expected deliverables
IMPLEMENTATION AND RESULTS OF MISSION • IMPLEMENTATION • ORGANIZATION AND WORKING METHOD A steering committee and field follow-up team were established in order to ensure that the mission was carried out in the required manner. Seventeen (17) high-level ressources (engineers, technicians and legal experts) were employed operationally within the framework of this mission.
IMPLEMENTATION AND RESULTS OF MISSION The ressources worked from 2 January to 26 February 2013 in physical meetings and conference calls, addressing the start-up, progress made, refocusing, and winding up of the mission. • SCOPE OF ACTIVITIES CONDUCTED In accordance with the initial distribution in the terms of reference, 122 points were indeed measured.
IMPLEMENTATION AND RESULTS OF MISSION • CHOICE OF MEASUREMENT POINTS Eligibility conditions • Density of radio installations; • Sensitivity of location (area of conflict with local populations, school, hospital,….); • Busy area; • Public accessibility (indoor/outdoor) • Global exposure level (> 0,3 V/m). Restricted access area Area open togeneral public Prohibitedarea Signage for general public Figure 2: Concept of area and of signage
IMPLEMENTATION AND RESULTS OF MISSION • Consultation of database • Based on ATCI’s distribution of the measurement points over all the communes selected, VALSCH Consulting proceeded as follows: • Mapped the location of 3632 multi-technology (GSM, WiMAX and UMTS) radio sites in operation; • Identified locations with a high density of radio sites; • Divided the mapping up intoseveral areas; • Consulted the database of complaints.
IMPLEMENTATION AND RESULTS OF MISSION Research (in situ) • Visual identification coupled with rapid analysis using broadband field metre for each candidate measurement point; • Competitive selection between three (3) candidates per measurement point retained.
IMPLEMENTATION AND RESULTS OF MISSION Figure 3 : National mapping of measurement sites Figure 4 : Mapping of measurement sites Abidjan district Measurement points: Classroom, kindergarten, hospital room, privateresidence, market, café, public areas
IMPLEMENTATION AND RESULTS OF MISSION • MEASURING EQUIPMENT Figure 5 : Broadband measurement station Figure 6 : Selective measurement stations
IMPLEMENTATION AND RESULTS OF MISSION Table 4: Composition of measurement chain N°1 Table 5: Composition of measurement chain N°2
IMPLEMENTATION AND RESULTS OF MISSION PARAMETERIZATION OF STATIONS IN ACCORDANCE WITH CENELEC 50492 • Detection mode; • Measurement mode; • Resolutionbandwidth (RBW); • Videobandwidth (VBW).
IMPLEMENTATION AND RESULTS OF MISSION • RESULTS In light of the values obtained in the broadbandmeasurements (all below 3 V/m) and in accordance with the measurementprocessflowchart, no detailedmeasurementwaseffected. All the measurementswereeffectedwith a view to making an informative evaluation of the fieldstrengthlevels by service. Thus, the channel power wasprocessed and the equipment de-noised by applying the channel power processing (CPP) formula in Annex D 3.2 to standard EN 50492, whoselinear transcription is as follows:
IMPLEMENTATION AND RESULTS OF MISSION In which [(Fmax-Fmin)/((Number of points SA-1) x RBW)] is the RBW filter imperfections correction parameter and SA designates spectrum analyser. For evaluation of compliance with exposure limits, Annex K to standard EN 50492 prescribes: Threshold ((Number of points SA-1) In whichEfis the electricfieldstrength at frequency f and EL.fis the correspondinglimit.
IMPLEMENTATION AND RESULTS OF MISSION • ASSESSMENT OF ELECTROMAGNETIC FIELD STRENGTHS Electric field strength V/m Measurement points Figure 7 : Summary histogram of levels of field strengths measured
IMPLEMENTATION AND RESULTS OF MISSION • EXTRACT OF DOMINANT FIELD STRENGTH VALUES • The dominant levels were obtained in the service bands: PMR beacon, aeronautical radionavigation excluding TV, WLL and radiolocation. • At the opposite extreme, the lowest field strength value was obtained at measurement point KORHOGO-05, with a value of 0.24794558 V/m .
IMPLEMENTATION AND RESULTS OF MISSION Total exposure Measurement points Figure 8 : Summary histogram of exposure levels • The highestexposurelevel wasobtained at point ADJAME-04, with a total exposure of 11%.
Conclusion and recommendations • Upon completion of this measurement campaign, we conclude that at the places, dates and times of the measurements, the field strength levels measured comply with the exposure limits set by ICNIRP. • We take this opportunity to encourage telecommunication regulators to implement best practices through similar campaigns aimed at applying the precautionary principle.