Download
1 / 45
490 likes | 700 Vues
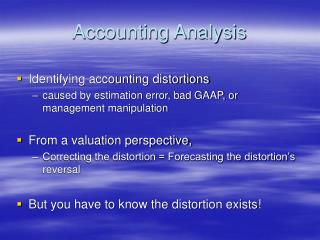
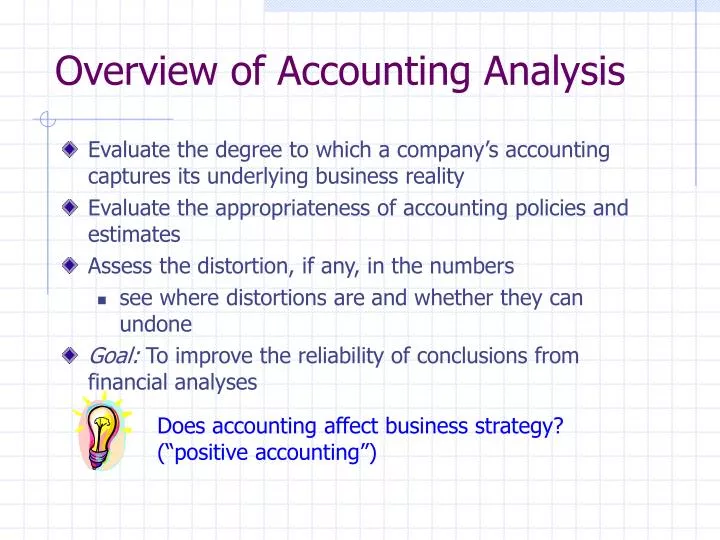
Overview of Accounting Analysis. Evaluate the degree to which a company’s accounting captures its underlying business reality Evaluate the appropriateness of accounting policies and estimates Assess the distortion, if any, in the numbers see where distortions are and whether they can undone

E N D
Overview of Accounting Analysis • Evaluate the degree to which a company’s accounting captures its underlying business reality • Evaluate the appropriateness of accounting policies and estimates • Assess the distortion, if any, in the numbers • see where distortions are and whether they can undone • Goal: To improve the reliability of conclusions from financial analyses Does accounting affect business strategy? (“positive accounting”)
Analysis of the Income Statement (Chapters 6 & 7) • Goal • Assess earnings quality and persistence • Exclude components of reported income (regardless their accounting labels) that reduce predictive ability • Predict future income and cash flows • Remember • The income statement is just one part of an information set that should be examined to estimate future earnings
Continuing or recurring: Revenues – Expenses = Operating income +/– Other income and loss = Pretax earnings from continuing operations – Income tax expense = After-tax income from continuing operations Non-Recurring (net of tax): Discontinued operations Extraordinary items Cumulative effect of accounting changes (mandatory, voluntary) Income Statement Items and Format
Income Statement Items and Format (continued) • Net income • +/-Other: foreign currency translation gains/losses, unrealized changes in market value of AFS securities, etc. • = Comprehensive income • Earnings per share (basic and diluted)
Earnings Management – the Revenue Side • Revenue Recognition: • Rule: (1) earnings process is complete or virtually complete (2) recognized or recognizable • Accrual basis is better than cash basis • Tendency to overstate revenue • Challenges: • Customers pay in advance • Products or services provided over multiple periods • Products or services sold, but seller retains the residual rights • Credit-worthiness of customers • Sales returns
Possible Time Points For Revenue Recognition • At time of sale (“normal”) • When goods are delivered or services are rendered • Before time of sale • Long-term construction: percentage of completion, completed-contract • More “liberal” • After time of sale • Installment sales, cost recovery, cash basis • More “conservative”
How About Sports Clubs? • Sell memberships for cash or in installment contracts • One-time membership fee • When should revenue from memberships recorded? When the membership agreements are signed? • Are memberships refundable? • How about the associated costs? • marketing • potential collection losses from installment collection of memberships • facility improvements?
More About Sports Clubs • The Operating Cash Flow amount and trend in Statement of Cash Flow becomes very important for the analysis • Check the discrepancy between income and OCF • If the discrepancy becomes larger and larger, there are definitely problems!
Earnings Management – The Expense Side • Matching principle and conservatism • Tendency to understate expense or classify into non-returning category • Challenges: • COGS: use specific identification method • R&D: capitalized rather than expensed • Repairs and maintenance: capitalized, deferred, accelerated • Investments: classify as available-for-sale • Operating expense: classify as “other” or special items • Depreciation and amortization: change useful lives • Pension: change assumptions • Ignore cost items: e.g. contingencies, impairments
Recurring Operating Income • Needs to be subjectively determined • Not always disclosed neatly • Think about the types of revenue “earned” by Boston Chicken(4-20) and other franchise business: • One-time initial franchise fees: when the store opens • Royalties on gross revenues: when the stores generate sales • Service fees for advertising campaigns • Interest income from franchise developers • Are all revenue equally “persistent”?
What are they? special charge non-recurring items merger expenses restructuring costs and a whole lot more! How are they disclosed? usually a separate line item Tendency to selectively highlight items How are they described? read MD&A, press releases Tendency to report favorable items lumped in operations and unfavorable items listed separately? I/S classification and quality of disclosure Unusual or Infrequent Items
Does Non-Recurring Mean To Ignore? • Maybe. Maybe not. Probably not! • What does the non-recurring item say about • prior accounting estimates • quality of prior management decisions • the economic environment • the quality of prior disclosures • impacts on cash flows
Discontinued Operations • Operating income and gains/losses from discontinued segments is shown separately, net of tax • Discontinue of a segment whose activities represent a separate major line of business or class of customer • Subjective • Determine gains/losses • Actual and expected • Impacts on future I/S
Extraordinary Items • Unusual AND Infrequent • Subjective • Gains and losses on early retirement of debt • Discretionary in timing • Varies by locations • Litigation settlements are sometimes included—depends on reason for lawsuit
Accounting Changes • Analyst should distinguish between mandatory and voluntary changes • Most mandated changes require • footnote disclosures • sometimes restatements are made in the F/S • A lot have no cash flow implications
“Prior Period Adjustments” • Usually relate to correction of accounting errors • Disclosed in Statement of Changes in Retained Earnings • Prior F/S resented together need to be retroactively adjusted
Other Issues • Big Bath Theory • Make it worse when it is bad already • Income Smoothing • Reduce earnings volatility
Analysis of Balance Sheet(Chapters 4 and 5) • Asset Analysis • Liability and Equity Analysis • Impacts on I/S
Analysis of Assets • What are “assets”? (1) Future economic benefits (2) Owned (3) Past transactions • Challenges: • Ownership is uncertain • Future economic benefits are difficult to measure • Human capital • Goodwill, brand names • Changes in economic value • Criticism: Historical and conservative
Investment • Equity securities and debt securities • Classification: • Equity securities with controlling interest less than 20 to 25% and debt securities • Trading securities • Held-to-maturity • Available-for-sale • TS are short-term; HTM and AFS depend • Affect I/S due to • sale • changes in market value • TS I/S • HTM R/E
Disclosure of Unrealized Holding Gains/Losses • Statement of SE • Comprehensive Income • E.g. Dell, page 32 • For 1999, Income would be $559 million higher if the unrealized holding gains were included
Accounts Receivable • Amount expected to be collected from customers • Affected by when revenue is recognized • Quality of receivable: check whether they are genuine, due, and enforceable • Allowance for uncollectible accounts • Estimate cash collected from customers • Perfect information • Net A/R OB + Allowance OB + sales – Net A/R EB – Allowance EB – Write off • Imperfect information • Net A/R OB + Sales – Net A/R EB
Estimate Cash Collections from Customers 1999 Sales = $221,932 Bad debt expense = $1,403 Write off of A/R = $1,459 Estimated cash collection: Most accurate: $25,282 + 221,932 – 1,459 – 28,074 = $217,681 Approximation: $24,049 + 221,932 – 26,897 = $219,084 Difference = $1,403, the amount of bad debt expense
Inventory • Inventory accounting choices: first-in, first-out (FIFO), last-in, first-out (LIFO), average cost, specific identification • LIFO versus FIFO • When inventory prices are increasing and no severe inventory liquidation • Which assumption result in • higher inventory amount on B/S? • higher net income on I/S? • “LIFO conformity rule” in the U.S.
Accounting Reporting for Inventory • Balance Sheet • Inventory as a current asset • Income Statement • Cost of goods sold • Loss due to decrease in inventory value • Notes • Inventory method • Inventory composition: finished goods, work-in-process, raw materials
More Inventory Disclosure by LIFO Firms • Philip Morris • Inventories: Inventories are stated at the lower of cost or market.The last-in,first-out (“LIFO ”) method is used to cost substantially all domestic inventories.The cost of other inventories is determined by the average cost or first-in,first-out methods. • Note 4. Inventories: The cost of approximately 47%and 50%of inventories in 1999 and 1998,respectively,was determined using the LIFO method. The stated LIFO values of inventories were approximately $0.8 billion and $1.1 billion lower than the current cost of inventories at December 31,1999 and 1998,respectively.
As-If FIFO Adjustment • Additional information for 1999: • Ending inventory = $9,028 million • Cost of sales = $29,561 million • Net income = $7,675 million • Effective tax rate = 40% • Adjustment: • As-If FIFO inventory = LIFO inventory + LIFO reserve = $9,028 + 800 = 9,828; an 8.9% increase • As-if FIFO COGS = LIFO COGS + Opening LIFO reserve – Ending LIFO reserve = $29,561 + 1,100 – 800 = $29,861; $300 more • As-IF FIFO income = LIFO income - (1-tax rate)x(Opening LIFO reserve – Ending LIFO reserve ) = $7,675 – 60% x 300 = $7,495; $180 LESS (?)
Property, Plant and Equipment (PPE) • Composition of PPE • E.g. Dell, page 47 • Depreciation method and depreciable years • Mostly straight-line for financial reporting purpose • E.g. • Buildings: Cost is $1,000; Accumulated depreciation is $700; depreciated over 10 years • Depreciated years = Accumulated depreciation Cost x Depreciable years = 700 1,000 x 10 = 7 years • Implication: Need to replace buildings in 3 years • Impairment
Analysis of Liability • What is a “liability”? (1) Future economic sacrifice (2) Owed (3) Past transactions • Challenge: • Not sure about the obligation • Amount and timing difficult to measure • Changes in economic value • Criticism: Off-Balance Sheet financing
Analysis of Liability:Off-Balance Sheet Obligations • What is Off-Balance Sheet financing? • Why do companies engage in it? • How can analysts recognize it? • What should analysts do about it?
What is Off-B/S Financing? • An arrangement whereby a company is able to avoid reporting obligations on its balance sheet • The company may also avoid the recognition of • related assets • related expenses
Why Do Companies Engage in Off-B/S Financing? • To make their B/S look better • less liability, less expense, higher income • Because everybody else is doing it • Because it adds financial flexibility • Avoid debt covenant violations • Enhance ability to obtain new capital
Examples of Off-B/S Financing • Unrecognized Pension Obligations • Operating leases • “Sale” of receivables with recourse
Why Should An Analyst Care? • The more debt a company has, the riskier it is • more fixed charges, lower income • Affect cost of capital computation • Affect the valuation analysis
Example: Leases • Why do companies lease? Why Lease Assets? Why not just Buy them? • Avoid risks of ownership and obsolesce • Lower down payment • Tax reasons • Lessor can use depreciation write off, but lessee can’t • Lessor is in a higher tax bracket than lessee • Don’t want to report assets on the books • Higher return on assets • Don’t want liabilities on the books • Bond covenants
Capital Lease versus Operating Lease • Statement of FASB No. 13 • Basic rationale: risks and benefits of ownership have been transferred from lessor to lessee • Transfer of title at end of lease term • Bargain purchase option at end of lease term • Lease Term is 75% or more of estimated useful life of the leased asset • Present value of lease payments is 90% or more of the fair market value of the leased asset
Operating Lease B/S: No asset, no liability I/S: Rent expense Capital Lease B/S: Leased asset and Lease obligation I/S: Depreciation expense Interest expense Comparison of Operating Lease and Capital Lease Capital lease: Higher liability Lower income in earlier years of lease term
Restatement of Operating Leases to Capital Leases • Why capitalize operating leases? • To show true risks faced by the company • To make different companies comparable • To assess risk and fixed charges on a more consistent basis • Procedure • Determine the amount and timing of future lease payments • Determine discount rate • Calculate present value of future payments as estimate of off-B/S lease liability • similar amount should be capitalized as an asset
B/S (p.29) : no leased assets, no lease liability Note 10 (p. 43)—Lease Commitments “master lease facilities”? Other noncancellable lease Minimum Lease Payments 2000 46 2001 34 2002 29 2003 183 2004 405 Thereafter 26 Total 723 Example—Dell
When do lease payments end? compare average payment and “thereafter” figure Average = 139.4 Thereafter = 26; can be ignored About 5 years payment stream: 46. 34, 29, 183, 405 Discount rate Note 3 (p.37) About 7% Present Value 461.07 +341.072 + 291.073 + 1831.074 + 405 1.075 = 524.7 Adjustment Dr. PPE 524.7 Cr. L-T debt 524.7 future periods should depreciate assets and record interest Lease Adjustment – Dell 1999
Lease Adjustment—Dell 1999 • Effect on 1999 earnings • Additional interest @7%: $36.73 • Additional depreciation, assume straight line over lease term $524.7 5 = $104.9 • Take off rental: $81 • Capitalizing lease decreases 2000 NIBT by: $23.9 • Effect on 2000 debt: • original: 507 • adjusted: 1,031.7; a 103.5% increase
Example: Pension Liability • Pension plan • Defined Contribution versus Defined Benefit • Actual pension liability • “Projected Benefit Obligation” (PBO) – Plan Assets • Reported pension liability • “Accrued Pension Cost” • Adjustments: • Actual - Reported
Off-B/S Financing—Summary • Firms have incentives to keep obligations off their balance sheets • A variety of ways exist to do so • The FASB has plugged holes, but still possible • Be prepared to restate the F/S to get the debt back on the books
Framework: Four Steps of Analysis Business Strategy Analysis Accounting Analysis Financial Analysis Prospective Analysis Business Analysis and Valuation Applications
Next Step: Financial Analysis Taxes Profitability Leverage Interest Efficiency