Download
1 / 48
550 likes | 1.01k Vues
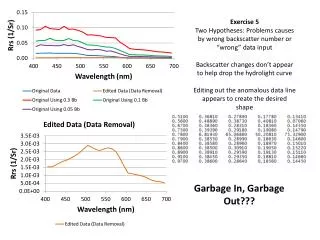
Garbage In, Garbage Out: Strategies to Ensure Data Quality. Larry Buron, Abt Associates Paula Schuiteman, Newaygo County Community Services (NCCS) Eileen Mitchell, Iowa Institute for Community Alliances (IICA) Richard Rankin, Data Remedies, LLC. Overview of Session. Learning Objectives

E N D
Garbage In, Garbage Out: Strategies to Ensure Data Quality Larry Buron, Abt Associates Paula Schuiteman, Newaygo County Community Services (NCCS) Eileen Mitchell, Iowa Institute for Community Alliances (IICA) Richard Rankin, Data Remedies, LLC
Overview of Session • Learning Objectives • Multiple Perspectives on Data Quality: Provider staff, system administrators and researchers • ‘Monitoring Bed Utilization Rates for Data Quality Control’ • ‘Ensuring Quality Data at the Provider Level’ • ‘HMIS All-Stars: Iowa’s Answer to Data Completion’ • ‘HMIS Data Completion’
Learning Objectives • To give HMIS project managers and program staff practical tips on improving data quality • To learn how to monitor data quality through utilization rates, custom reports and regular user meetings. • To learn of management techniques to create incentives to promote data quality and to make HMIS data quality a priority within their continuum.
Data Quality: Monitoring Bed Utilization Rates for Data Quality Control Larry Buron, Abt Associates
What are Bed Utilization Rates? • The bed utilization rate is the percentages of beds that are used on a particular day or the percentage of beds that are used on an average day during a particular time period. • Utilization is calculated as follows : # of clients served on ÷ # of beds = Bed Utilization average day Rate
Bed Utilization Rates: An Example • For example, if a community serves 180 individuals in emergency shelters on an average day during a particular month and has 200 beds available for emergency shelters serving individuals, the bed utilization rate is: 180 ÷ 200 = 90% • Bed utilization rates can be calculated for a single provider, an entire community, or any other level of aggregation. • For non-residential providers, a similar utilization rate can be calculated in terms of service slots.
Inaccurate Bed Utilization Rates Means Inaccurate Information for Making Policy Decisions Inaccurate bed utilization rates means your community does not know: • The number of homeless people using shelters • The number of days people are using shelters • The characteristics of sheltered homeless people served on a particular day or period of time • What types of providers need more capacity and what types have extra capacity.
Bed Utilization Rates from 2005 CoC Applications Note: In the summer of 2006, HUD was following up with CoCs to clean up these data prior to using them in their report to Congress.
Reasons for Excessively High Utilization Rates (e.g., over 100 percent) • Missing exit dates • Missing exit dates for people who leave the shelter leads to an over-count of homeless people served on a particular day or time period. • Inaccurate, low bed counts • Inadequate deduplication (affects over time counts and average daily utilization based on over time counts) • Accounting for people who use overflow beds, but not the beds
Reasons for Excessively Low Utilization Rate (e.g., below 50%) • Not entering information on everyone served in HMIS leading to undercount of the number of people served. • Inaccurate, high bed counts • For family programs, not all beds in occupied unit may be used
Suggestions for Improving Accuracy of Counts of Number of People Served • Regularly review utilization rates by provider and ask for confirmation of number of people served for unusual rates: See sample worksheet • Compare utilization rates across similar providers to identify possibly erroneous rates. • Use the counts and utilization rates for funding, policy decisions, and evaluations. When people see the numbers are important to decisions, they have and incentive to ensure they are accurate. • Compare the number of people served from HMIS to point-in-time count reported for CoC Application (if from a different source)
More Suggestions for Improving Accuracy of Counts of Number of People Served • Match people listed in HMIS to bed logs if separate logs are kept. • Visit provider to confirm accuracy. • Automatically enter exit dates for overnight shelters. • Identify specific records for confirmation by provider if length of stay seems excessive. • If long-term problem, exit everyone and have provider re-enter only those persons still being served. • Design system so persons cannot be listed as staying at two residential providers at the same time. • Increase training of front-line staff who enter the information.
Suggestions for Improving Accuracy of Number of Beds Available • Regularly review utilization rates by provider and ask for confirmation of bed inventory for unusual rates: see sample worksheet • Calculate bed utilization rate with overflow beds if appropriate • Visit provider to confirm accuracy of bed counts • Make sure CoC Housing Inventory information is internally consistent. • Some apps have family units listed, but not beds • Others have # of beds participating in HMIS, but nothing in column for total # of beds available • Some list providers that do not serve homeless people • Some have wrong geocode for location of program • Aim for 100% accuracy of information needed for deduplication
Worksheet to Monitor Bed Utilization Rates Monthly † Include seasonal beds in the denominator if they are open during the month.
Conclusion • Inaccurate bed utilization rates point to problems in the count of the number of sheltered homeless people or to inaccurate counts of beds available to serve homeless people • Accurate utilization rates are important – they can help you determine whether you have too few or too many resources for serving certain types of residential providers • They also point to problems in all the information you have on sheltered homeless people • You can address the issue: the main emphasis has to be on entering information on everyone who is served and exiting people no longer being served
Ensuring Quality Data at the Provider Level Paula Schuiteman, Newaygo County Community Services (NCCS)
Ensuring Quality Data: • Constantly run reports • Clients, services, needs • Track self-assessment reports • Clients without service transactions, DOBs, disability status,program entry dates or other Universal Data Elements • Compare data from different reports • e.g. Service needs transactions vs. needs transaction reports
Identifying Data Inconsistencies: • Run reports that are clear and concise • Be familiar with data being entered and reported • Entries should be done in “real time” • Use data quality reports to track user entries (i.e. data entered “yes” but no sub-assessment follow up) • Disability incongruities • Chronic homeless • Zip codes
Potential User Entry Problems • Overload on users from data entry backlogs • Users who are not “computer friendly” • Users who do not understand HMIS at the beginning/training level • Users who “rush” through data entry • Lack of communication between users, System Administrators and HMIS providers
Solving User Entry Challenges • Be selective in staff who will be entering data at the beginning • Hire additional data entry support (or use existing personnel) • Use specific staff for data entry to reduce errors • Use/hire additional staff during peak times
Solving User Entry Challenges (con’t): • Constant communication done at training level will ensure a comfort level with HMIS • Re-train individuals until comfortable with HMIS via “go to meetings” • Run reports on individual users to ensure quality data entry • Run random reports that match up with “paper trails” • Follow up with client entries with users that are new to system
Innovations with HMISforNewaygo County Community Services (NCCS) • Scan cards at front desk • Strengths: streamlined services • Challenges: consistency and data quality
Scan cards: Food Programs On-site and off-site programs • Strengths- handle high volume and streamline client service • Challenges- volume of program users, data entry, and wireless connections
Scan cards: Children’s Christmas Programs • Strengths: handle high volume and streamline service • Challenges: volume of program users and data entry for 3,400 children in one week
HMIS All-StarsIowa’s Answer to HMIS Data Completion Eileen Mitchell, Iowa Institute for Community Alliances (IICA)
Why HMIS All-Stars? • Decided not to use HMIS software to make all fields required • Did not want to create barriers in HMIS • Did not want to force users to input incorrect information just to file a record • Required fields could still be blank if user does not access that page in the HMIS • Needed alternate method of ensuring data completion
What Did Not Work • Providing agencies with reports that they use to self-monitor • Certification/sign-off reports • Just giving people the tools to see how they were doing not enough to make a difference.
What Worked • All-Stars program • After the 15th of every month, we measure data completion rates for new client entries for the previous month. • All agencies that had overall null value percentage of 5% or less are included on the All-Stars list. The list consists of agency name and null percentage. • The All-Stars list is emailed out statewide to our full distribution list, including HMIS users, agency directors and funders.
Agencies and Programs Included All programs participating in HMIS: • Emergency shelter • Transitional housing • Homeless prevention • Services only • Outreach • PATH • HOPWA
Date of Birth Race Gender Ethnicity Disability of long duration Is client homeless Is client chronically homeless Living situation on night before program entry Length of stay Last permanent zip code Zip code data quality Total monthly cash income U.S. military veteran status What we currently measure
Results • All-Stars started in January 2006 Statewide Null Percentages: • January 2006: 15% • February 2006: 12% • March 2006: 10% • April 2006: 8% • May 2006: 7%
Why did All-Stars work? • Public recognition • Public scrutiny • Friendly competition • Ongoing feedback It is easier to do poorly in private than in public.
All Star Criteria • Combined results for all programs within an agency must meet the 5% threshold. • The agency must meet a threshold for number of clients entered. • The percentage is calculated as the agency’s total responses/total responses expected. • Currently, an agency may be more than 5% null on one or more fields if the overall total is less than 5%.
What next? • Raise the bar once the current goal is met. • Potential future All-Stars rules: • Every targeted field must be 5% null or less • Fields contributing to the unique identifier must be 2% null or less • Data entry timeliness targets: data entry within X days of program entry • Include more of the recommended program data elements
Other Strategies for Improving Data Quality • Self-monitoring reports • Open Entry/Exit report: list of all clients with no exit date • Total Entries report: list of all clients entered during a specified time frame • Data completion report: list of clients entered with data element responses and flags for missing information. • Tip of the Week • Each week feature a different data element or concept and email out an in-depth look at the topic.
Tip of the Week • See handouts for samples
HMIS Data Completion Richard Rankin Data Remedies, LLC
Why the approach • To ensure data completion for each record without using software to make all fields required • To validate that data is accurate and compliant with HUD Standards
What was not working • Annual Report checks • The expectation for agency to voluntarily check their data periodically for quality and data integrity was not working. • Relying on users entering the data voluntarily to complete the records • Relying on site visits not efficient
Reports • Missing Universal Data Elements – Detail • Missing Universal Data Elements – Summary • Missing Program Specific Data Elements – Detail • Missing Program Specific Data Elements – Summary
Report Functions • Detail Report: • Broken down by agency and user: • Grouped by Client ID#- no personally identifying info. • Indicates when a record is incomplete and why it is incomplete • Points to exactly what data is missing and where • Summary Report: • Gives percentage of valid entries by data element by agency • Used by supervisory staff as an overall report card of data completion by agency
Logic Examples • Pregnancy Status • ‘Age’ >= 12 AND ‘Gender’ = Female AND • (‘Pregnancy Status’ = Null OR ‘Due Date’= Null ) • Disabilities • ‘Do you have a disability of long duration’ = “Yes” AND • (‘Physical Disability’= Null OR • ‘Developmental Disability’ = Null OR • ‘HIV/AIDS’ = Null OR • ‘Mental Health Problem’ = Null OR • (‘Mental Health Problem’ =Yes AND ‘Expected to be of long-continued and indefinite duration and substantially impairs ability to live independently’ = Null) OR • ‘Substance Abuse Problem’ = Null OR • (‘Substance Abuse Problem’ = Yes and ‘Expected to be of long-continued and indefinite duration and substantially impairs ability to live independently’ = Null))
Other Strategies for Improving Data Quality • Coordinate with Housing Authority, periodically check S+C lists from HA and agency list. • Entry / Exit reports, report new entries and those without exit dates • Training • Implemented monthly trainings on rotating subject basis, I.e., • HUD programs both for new users and existing users • PATH programs • Corrections • Food Shelf