Download
1 / 13
130 likes | 243 Vues
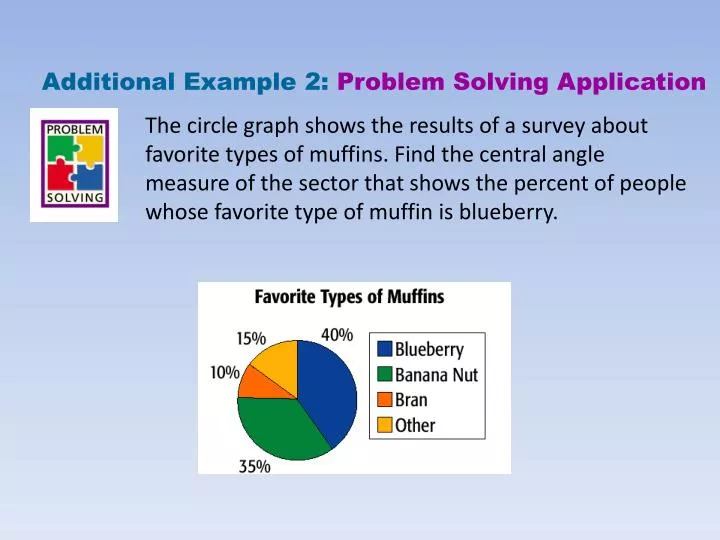
Additional Example 2: Problem Solving Application. The circle graph shows the results of a survey about favorite types of muffins. Find the central angle measure of the sector that shows the percent of people whose favorite type of muffin is blueberry. 1. Understand the Problem.

E N D
Additional Example 2:Problem Solving Application The circle graph shows the results of a survey about favorite types of muffins. Find the central angle measure of the sector that shows the percent of people whose favorite type of muffin is blueberry.
1 Understand the Problem Additional Example 2 Continued The answer is the measure of the central angle that represents blueberry. List the important information: • The percent of people whose favorite muffin is blueberry is 40%. • The central angle measure of the sector that represents this group is 40% of the 360° of the circle.
3 Solve Make a Plan 2 Additional Example 2 Continued There are 360° in a circle. Since the sector is 40% of the circle graph, the central angle is 40% of the 360° in the circle. 40% of 360° = 0.40 · 360° 0.40 · 360° = 144° Multiply. The central angle of the sector is 144°.
4 Additional Example 2 Continued Look Back The 40% sector is less than half the graph, and 144° is less than half of 360°. Therefore, the answer is reasonable.
Try This: Example 2 The circle graph shows the results of a survey about the favorite types of muffins. Find the central angle measure of the sector that shows the percent of people whose favorite type of muffin is banana nut.
1 Understand the Problem Try This: Example 2 Continued The answer is the measure of the central angle that represents banana nut. List the important information: • The percent of people whose favorite muffin is banana nut is 35%. • The central angle measure of the sector that represents this group is 35% of the 360° of the circle.
Circle Graphs A graph made of a circle divided into sectors. Also called pie graph.
Parts of a Circle Graph Graph Title – the title tells what the graph is representing. Sectors – Each sector is one part of the whole circle. Sector Labels – Each label tells what the sector represents. The Perfect Pizza 55% cheese 15% sauce 30% pepperoni
How to make a circle graph • Using a compass, draw a circle large enough to show all of your data. • Determine how many sectors you will need in your graph. You will need to know the percentages of the whole of your data. Try to make the sector sizes look as close to the percentage of the circle as the percentage of your data. • Label each sector and give your graph a title.
Activity Example Survey your classroom for cafeteria favorites. Choose four different lunches and gather the data. Make a table to show data.
You must now change the numbers to percentages. To do this, change each number to a fraction. 10/25 8/25 5/25 2/25 Then divide the numerator by the denominator. 10/25=.40 8/25=.32 5/25=.20 2/25=.08 Then multiply the answer by 100 .40*100=40% .32*100=32% .20*100=20% .08*100=8% Now you are ready to draw your circle graph.
First you will need to divide your circle into approximate sectors to represent each percentage. Label each sector with the appropriate name and percentage. Chicken 32% Pizza 40% Spaghetti 20% Fish 8%
Finally, give your graph a title. Favorite Lunch Foods Chicken 32% Pizza 40% Spaghetti 20% Fish 8%