Download
1 / 49
560 likes | 1.05k Vues
Chapter 22 Using Data Analysis Tools of Data Tables, Goal Seek, Solver, and Scenario. Excel 2003, Volume 2 by Karen J. Jolly. Outcomes. Create one- and two-variable data tables. Use the analysis business tools. Goal Seek Solver Scenario. About Data Analysis Tools.

E N D
Chapter 22Using Data Analysis Tools of Data Tables, Goal Seek, Solver, and Scenario Excel 2003, Volume 2 by Karen J. Jolly © Scott/Jones Publishing, Inc.
Outcomes • Create one- and two-variable data tables. • Use the analysis business tools. • Goal Seek • Solver • Scenario © Scott/Jones Publishing, Inc.
About Data Analysis Tools • Data tables provide a quick comparison of business problems when one or two variables may change. • Goal Seek, optimizes a goal and provides a solution when one variable changes. • Solver provides solutions when more than variable may be changed. • Scenarios create several different solutions for a complex business problem. © Scott/Jones Publishing, Inc.
What-If Analysis • What-If analysis allows businesses to analyze their financial picture to forecast and make other financial decisions. • Typical questions asked: • “What if the interest rate decreases?” • “What if the markup rate increases by 1%?” • “What if the travel budget is decreased by 10%?” • “What if we increase production by 15%?” © Scott/Jones Publishing, Inc.
Basics of What-If Analysis • Analysis quickly completed with Excel. • Performed by changing values in input cells. • Dependent cell • usually contains a formula. • changes when input data changes. • Model worksheet contains the what-if analysis. © Scott/Jones Publishing, Inc.
Procedures for Planning Analysis • Define the problem • Input values • Dependent cells • Results • Complete the analysis © Scott/Jones Publishing, Inc.
Define the Problem • The problem must be clearly defined to begin the what-if analysis. • Scenario: a couple want to purchase a home and cannot have payments larger than $1,200 per month. • Problem definition: what is the maximum purchase price they can pay for a house? © Scott/Jones Publishing, Inc.
Input Values • Determine the data input values: • Amount of the loan (principal) • Interest Rate • Length of loan Guess © Scott/Jones Publishing, Inc.
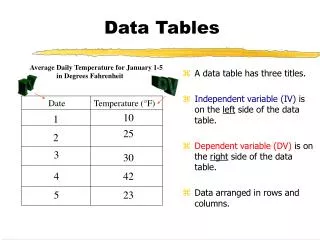
Dependent Cells • Determine which cells contain formulas – dependent cells. Input cells Dependent cell © Scott/Jones Publishing, Inc.
Results • What are the results given the input data? • Monthly payment =$1,945.79 • Do the results match the requirements? • No, payment must be max $1,200 • If not, change the input data to obtain the needed results. • What happens if interest rate changes? • What happens if purchase price changes? © Scott/Jones Publishing, Inc.
Complete the Analysis • Enter variables and determine the result. • Make changes in data until desired result is obtained. • Analysis completion will differ depending on which what-if tool is used. © Scott/Jones Publishing, Inc.
Data Tables A data tableautomates data analysis and organizes the results when one or two variables change. © Scott/Jones Publishing, Inc.
One-Variable Data Table • A one-variable data table is used to evaluate financial information for decision making. • Only one variable is changing: • In a business, what happens when net sales change? • How do interest rates affect the monthly payment on a car loan? © Scott/Jones Publishing, Inc.
Use a One-Variable Data Table • Define the Problem: • What effect will interest rates have on loan payments? • Create the worksheet. © Scott/Jones Publishing, Inc.
Enter formula to determine amount of payment Use a One-Variable Data Table Enter input values to tested © Scott/Jones Publishing, Inc.
Use a One-Variable Data Table • From the Data menu select Table. • Determine if input values have been entered as columns or as rows. © Scott/Jones Publishing, Inc.
Use a One-Variable Data Table—Cont. • Enter the input cell – the cell in the original worksheet that contains the variable (interest rate). • Enter input cell as absolute value. © Scott/Jones Publishing, Inc.
Completed Data Table © Scott/Jones Publishing, Inc.
Two-Variable Data Table • Makes financial comparisons when two variables change. • Uses one formula to evaluate two sets of variables. • Example: What happens if interest rate and length of loan change? © Scott/Jones Publishing, Inc.
Use a Two-Variable Data Table • Complete the worksheet. © Scott/Jones Publishing, Inc.
Use a Two-Variable Data Table Place the formula between the two variables Create a data table with both variables © Scott/Jones Publishing, Inc.
Use a Two-Variable Data Table • In Row input cell, input cell that contains the original value of the principal. • In Column input cell, input cell that contains the original value of the interest rate. © Scott/Jones Publishing, Inc.
Completed Two-Variable Data Table © Scott/Jones Publishing, Inc.
Goal Seek • Only one variable will change. • Maximizes the results within the other financial constraints. • Example: maximize the cost of a remodeling project where payments do not exceed $1200 per month. © Scott/Jones Publishing, Inc.
Use Goal Seek • Complete the worksheet. • Select the cell containing the formula. © Scott/Jones Publishing, Inc.
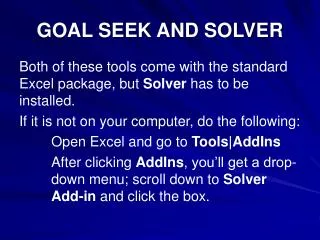
Use Goal Seek • From the Tools menu select Goal Seek © Scott/Jones Publishing, Inc.
Use Goal Seek Set cell containsthe formula To value is the valueyou want the set cellto be (max payment) The cell to changeto obtain desiredresult (principal) © Scott/Jones Publishing, Inc.
Completed Goal Seek Maximum amount of loan © Scott/Jones Publishing, Inc.
Solver • What-if solutions often affect more than one factor. • Example: how to change production quantity given multiple variables; i.e. multiple product lines, available resources. • Solver determines optimum value of data by changing other data factors. • Constraints can be used to limit how values change. © Scott/Jones Publishing, Inc.
Prepare for Solver © Scott/Jones Publishing, Inc.
Use Solver • From the Tools menu select Solver. © Scott/Jones Publishing, Inc.
Use Solver • Determine target cell – the limiting conditions for the problem. • Determine if the target cell should be maximized, minimized or equal to a value. Solver Parameters Dialog Box © Scott/Jones Publishing, Inc.
Use Solver • Enter the changing (or adjusting) cells that contain variables that will change the results. © Scott/Jones Publishing, Inc.
Use Solver • Determine the constraintsthat will limit the changing values. • Cells that change are called changing or adjustablecells. • Click Add to add a new constraint. © Scott/Jones Publishing, Inc.
Use Solver Completed Solver Parameter © Scott/Jones Publishing, Inc.
Use Solver • Click Solve. Solver has founda solution Keep solution or restore original values Solver Results Dialog Box © Scott/Jones Publishing, Inc.
Solver Results Changingcells © Scott/Jones Publishing, Inc.
Scenario Manager • Use Scenario Manager to solve complex business solutions when more than one factor can be used. • A scenario is a set of values used to forecast results of a what-if model. • A what-if model is a worksheet that contains different sets of values for the variables. © Scott/Jones Publishing, Inc.
Scenario Manager • Scenarios are useful when data is uncertain. • A scenario may contain up to 32 variables. • Use Scenario Manager to determine best case and worst case scenarios. • Scenario Manager finds solutions to complex business problems. • Use named cells to help analyze results. © Scott/Jones Publishing, Inc.
Use Scenario Manager • Create a worksheet with known information. © Scott/Jones Publishing, Inc.
Use Scenario Manager Create Scenarios © Scott/Jones Publishing, Inc.
Use Scenario Manager • From the Tools menu select Scenarios. Click on Add Scenario Manager Dialog Box © Scott/Jones Publishing, Inc.
Use Scenario Manager • Name the scenario. • Identify changing cells on original worksheet. • Add comments as needed. • Click OK. © Scott/Jones Publishing, Inc.
Use Scenario Manager • Edit the amounts for that specific scenario. • For each scenario enter the variables that apply. • Continue to add scenarios until each has been set up. Scenario Values Dialog Box © Scott/Jones Publishing, Inc.
Use Scenario Manager • Select a scenario. • Click Show. • Variables in the current worksheet are replaced by those in the scenario. © Scott/Jones Publishing, Inc.
Scenario Summary Report • A summary of the results of all scenarios can be displayed in a separate worksheet. • Access Scenario Summary dialog box. © Scott/Jones Publishing, Inc.
Scenario Summary Report © Scott/Jones Publishing, Inc.
Scenario Summary Pivot Table © Scott/Jones Publishing, Inc.
The End © Scott/Jones Publishing, Inc.