Download
1 / 32
320 likes | 323 Vues
This presentation explores water demand patterns and trends in North Carolina, analyzing data from 119 utilities across multiple years. It highlights regional variations, overall usage decline, and decreasing water usage per connection. Factors such as rate changes, efficiency improvements, and weather impacts are also discussed.

E N D
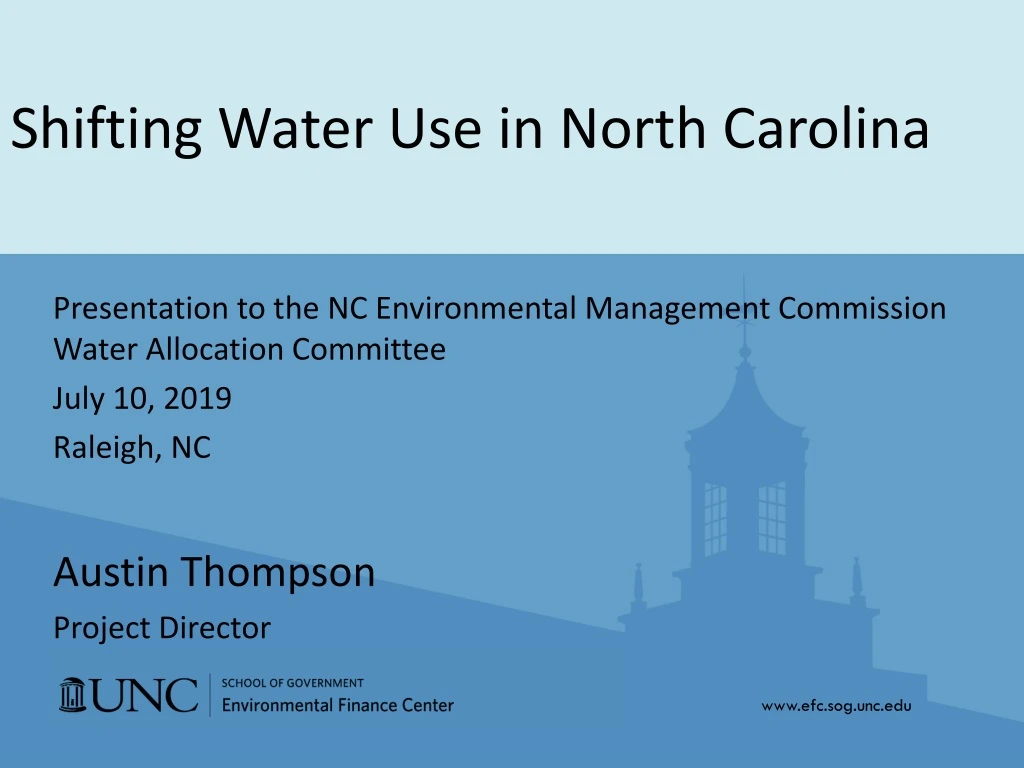
Shifting Water Use in North Carolina Presentation to the NC Environmental Management Commission Water Allocation Committee July 10, 2019 Raleigh, NC Austin Thompson Project Director
Dedicated to enhancing the ability of governments and other organizations to provide environmental programs and services in fair, effective, and financially sustainable ways through: • Applied Research • Teaching and Outreach • Program Design and Evaluation How you pay for it matters.
Measuring “Water Demand” • Gallons per connection per month • MGD Total • Withdrawals vs. treated into system vs. metered • Gallons per capita per day
Types of Analysis Just for this meeting • LWSP Analysis • LGC Sales Data • Utility Level Analysis Examples of analysis common at the EFC
Takeaways Spoiler! • Water usage patterns differ in different regions • Overall water usage is falling across the state • Water usage per connection is falling across the state
The Data • LWSP Data • 2002, 2007, 2012, 2016, 2017 • 119 utilities • Metered usage (MGD) • Residential • Non-Residential • Metered connections • Residential • Non-Residential
Total Metered Water Use by Category For the Sample of 119 Utilities Present in 2002, 2007, 2012, 2016, & 2017
Total Residential Usage vs. Total Residential Metered ConnectionsFor the Sample of 119 Utilities Present in 2002, 2007, 2012, 2016, & 2017
Total Non-Residential Usage vs. Total Non-Residential Metered Connections For the Sample of 119 Utilities Present in 2002, 2007, 2012, 2016, & 2017
Table of Residential Metered Water Use per ConnectionFor the Sample of 119 Utilities Present in 2002, 2007, 2012, 2016, & 2017 *In Gallons/Day
Table of Residential Metered Water Use per ConnectionFor the Sample of 45 “Small” Utilities and 22 “Large” Utilities *In Gallons/Day
Have Connections Trended Differently Across the State?For the Sample of Utilities Present in 2002, 2007, 2012, 2016, & 2017
Has Residential Use Shifted Differently Across the State?For the Sample of Utilities Present in 2002, 2007, 2012, 2016, & 2017
Fair Bluff, NC • One of five towns in SE NC that was part of a thorough viability analysis by Division of Water Infrastructure • Suffered flooding after Matthew, then again with Florence • Right along the Lumber River September 16, 2018 Photo: post-Hurricane Matthew, 2016, The Sun News
Rate Changes Figure 1: Average Monthly Customer Water Bill: Forecasted based on Bill Trends vs. CPIat 4,000 Gallons, 2009-2030 (n=226 utilities) Circle of Blue, The Price of Water, 2019
Weather In the last five years, NC has experienced an uptick in the observed annual precipitation. We know this isn’t uniformly distributed across the state, but it can have an impact on demand. Source: CICS-NC and NOAA NCEI.
Weather In addition to the unequal spatial distribution, the recent uptick in precipitation hasn’t been uniform across time. Between 2015-2018, NC experienced more extreme precipitation events than any five year period since 1995-2000. In short, we know weather impacts demand, but we can’t say by how much, or where… Source: CICS-NC and NOAA NCEI.
Reminder!Takeaways • Water usage patterns differ in different regions • Overall water usage is falling across the state • Water usage per connection is falling across the state