Download
1 / 50
571 likes | 727 Vues
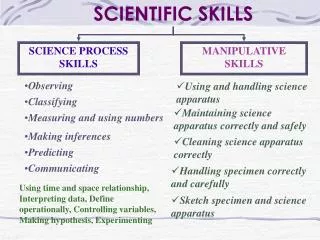
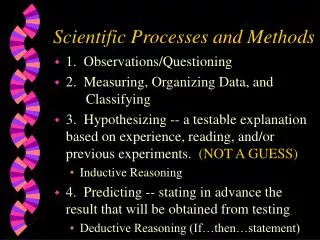
Scientific Skills and Processes. 1. OBSERVING. Slimy. orange colored. TALL. Stating the properties or characteristics of an object or event. Kinds of Observation. Qualitative. Physical Description. Quantitative. Measuring or Counting. 2. COMPARING.

E N D
1. OBSERVING Slimy orange colored TALL Stating the properties or characteristics of an object or event.
Kinds of Observation Qualitative • Physical Description Quantitative • Measuring or Counting
2. COMPARING Recognizing similarities and differences in the properties of objects and living things observed.
3. CLASSIFYING Process of arranging, grouping or sorting things according to some observable properties they possess.
Can you group the following animals according to their properties? Birds Mammals Insects
4. INFERRING Logical mental process wherein one makes explanations based on observations.
OBSERVING VS. INFERRING What can you say about the picture? • The sky appears red. • The sun is going down the horizon. • There are four people in the picture. • It is near dusk. • The four people are in a resort island.
5. PREDICTING Process of estimating or forecasting a future event or trend based on previous experiences or observation
Process of predicting data or events within the graph of the given data Process of predicting data or events beyond the scope of the given graph of the data Extrapolating Interpolating
What is the distance when the time is 4 seconds? Interpolating
What is the distance when the time is 12 seconds? Extrapolating
6. MEASURING Process of quantifying observations or properties of objects
MEASUREMENT COMPARING A QUANTITY TO AN APPROPRIATE SCALE OR STANDARD Closeness of a measured value to the true value ACCURACY Degree of agreement between several values obtained under the same conditions PRECISION
Given 3 darts: Neither accurate nor precise
How is the accuracy and precision of measurements determined?
Given the following experimental data for the density of water: If the accepted value for the density of water is 1.00g/ml, which measurement is the most ACCURATE?
Which measurement is the most PRECISE? Get the average. Average: 0.99 g/ml
7. Formulating the Problem • Be stated beginning with the words Why and How. • Contain the subject of the research. • Indicate the variable/s being tested and the corresponding responding variable/s • Give its readers an idea of what the experiment is about. The problem should:
8. Making a Hypothesis • An educated guess to a problem Example: • What causes the spoilage of food? • Why does the heartbeat of a person vary?
9. CONTROLLING VARIABLES Factors that affect the behavior or properties of an object or event Variables
Example: What conditions affect the growth of plants? • Amount of fertilizer • Type of soil • Amount of water • Amount of sunlight • Kind of plant specie These are all VARIABLES !
KINDS OF VARIABLES Experimental • MANIPULATED • CONTROLLED • RESPONDING Constant Affected
Example: How does the amount of fertilizer affect the growth of a tomato plant? Amount of fertilizer Manipulated Variable Responding Variable Growth of the tomato plant Amount of sunlight Amount of water Controlled Variable
10. ORGANIZING DATA • PRESENTATION OF THE DATA FOR ANALYSIS GRAPHS TABLES
GRAPHS Pictorial representation of data Histogram Bar graph Line graph Pie graph
Make a data table Identify the variables Making a data table A group of students made a survey of the products derived from coconut trees. They came up with the following data: • Foliage/leaves broom, roofing • Nuts/fruits food, drinks, husks • Roots disinfectant, medicine, driftwood • Cellulose paper, plywood • Lumber toys, posts, fuel
Interpreting tables As the number of marbles increases, the level of water also increases.
11. DERIVING CONCLUSIONS • A STATEMENT OF THE ANSWER TO THE PROBLEM OF THE EXPERIMENT
Example: Given the following data table: What is the Experiment About?
Identify the manipulated variable. Condition of Moisture
Identify the responding variable. Presence of Molds
State the best problem for the experiment How does moisture affect the appearance of molds in bread?
THE END... made by RRO