Download
1 / 32
320 likes | 444 Vues
The status report of the AURIGA detector. Luca Taffarello (INFN Sezione di Padova ). Special tanks to L. Conti and G. Vedovato. Summary of the talk:. New detector set-up First Results, calibration and thermal behaviour BUT evidence of noise peaks

E N D
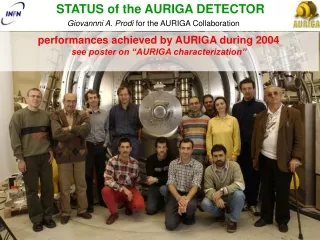
The status report of the AURIGA detector Luca Taffarello (INFN Sezione di Padova ) Special tanks to L. Conti and G. Vedovato Luca Taffarello
Summary of the talk: • New detector set-up • First Results, calibration and thermal behaviour BUT evidence of noise peaks • External excitation to identify the input ports to avoid the noise (mechanical excitation @ low frequencies) • Strategy to overcome the disturbances • Definition of epoch vetoes in A.D. througt thresold identification • New dampers and pneumatic isolation system @ low frequencies • Result achieve • Good data in nigth and week end (2° Dec 2004-18° May 2005) • Very stable and gaussian behaviour (from 19 May 2005) Luca Taffarello
Expected target AURIGA II run with 1999-2003 upgrades new mechanical suspensions: attenuation > 360 dB at 1 kHz FEM modelled new capacitive transducer: two-modes (1 mechanical+1 electrical) optimized mass new amplifier: double stage SQUID 200 henergy resolution new data analysis: C++ object oriented code frame data format Luca Taffarello
Setting @ T = 4.5K = experimental. data = simulation Evidence of spurious peaks in the bandwidth immediatly is started a diagnostic phase to address the spurious features in the noise spectra Best quiet period December 2003 Luca Taffarello
n=865.68 Hz ‚n=914.14 Hz First step: Calibration of the 3 sensitives modes The thermal behaviour of the modes is estimates by the measurement of the real part of the input impedence to the SQUID a 4.5 K ‚ ƒ ƒn=955.63 Hz T= 4.5 K E bias=7.5 MV/m Not evident lost of charge This is thermal Luca Taffarello
2 Step: THE MECHANICAL TRANSFER FUNCTION • mechanical mode near the switch • Electrome-chanical modes • Mechanical modes of the charge plates ƒ ‚ VERY IMPORTANT not evident excitation with mechanical and-or electromagnetic actuators Luca Taffarello
Complete control of the internal sources of noise (Note: one-sided spectra !) December 2004 after the first up-grading detector up the rubber Luca Taffarello
Strategy to cope the spurious peaks • Identification of noise sources: noise hunting • Definition of the possible hardware solutions: 2 steps • Rubber dissipation layer below the cryostat (roll-off frequency 8-10 Hz Q=2) • Active-air mount (Vibraplane KS) automatic leveling/heigth control low vertical natural frequency and orizontal isolation 1-2 Hz internal damping Q=2 and broad load range) Very important parameter the Q factor to avoid other nolinear-coupling where the seismic power is higher and the movement of the cryostat can generate dangerous mechanical stress in the detector • Decision to maintain on air the detector because from the analysis data is possible to understand more what is wrong and to control directly the efficiency of the new set-up • Definition of epoch vetoes to obtain time period of data workable Luca Taffarello
Noise hunting: 3 step analysis • Definition of peaks or band noise sources • Identification of noise sensitive peaks out bandwidth • Application of epoch vetoes based by crossing thresholds previous defined applied to this out bandwidth peaks Luca Taffarello
SQUID output 18-22 Hz Analysis of auxiliary channels Spurious peak in bandwidth 894 Hz Acc. Inside vacuum chamber 8-22 Hz Sismometer 8-22 Hz 4 days friday- monday Luca Taffarello
Evidence of connection between external (seismic) activities and bandwidth sensitive bandwidth OUTPUT of SISMOMETER in the cryostat 0-22 Hz 1 DAY Not Possible to determine a correlation between the external disturbances and the response in the sensitive bandwidth Evidence for not-linearity behaviour Luca Taffarello
Low frequency mechanical excitation and response in the detector bandwidth 2 example also without electrical field Shaking frequency 16.57 Hz Effect: some cluster with more peaks equidistant 16.57/3 Hz Shaking frequency 18.62 Hz Effect: all the multiple Not possible to reach shaking frequency below 10 Hz the seismic noise is too power Luca Taffarello
950 Hz Sp Sp Sp Sp 900 Hz Sp Sunday - Clean Spectrum One year of data between dec. 03 to dec 04 Sp= spurious Luca Taffarello
Clean/NoisySpectrum “Normal” Noisy spectrum Luca Taffarello
Run 590 (Time-Frequency) from Sat 11h-13/11/04 to Mon 12h-15/11/04 Clean Raw Data Sat Sun Noisy Raw Data Mon Only during the Sunday nigth is possible see the better spectra duty cycle Gaussian and stationary very poor 20 %, evidence of Monday morning effect, Human Activities? Luca Taffarello
Noisy Raw Data F5 F5 F5 F5 F1 F1 F1 F1 Run 590 (Time-Frequency) 5 hours It is possible to define some group of spurious peaks correlated F means Family, during the history different family appear and dissapear Luca Taffarello
More clean data, long period good in the nigths and in week-end F5 Veto (120 s) 236.95 +/- 0.2 Hz Run 608 - Vetoes Wide Band Veto F1 Veto (60 s) 241.25 +/- 0.5 Hz F7 Veto (60 s) 1133.2 +/- 2 Hz Wide Band Spurious F1 F5 F7 4000 s Time-frequency behaviour during normal day Luca Taffarello
F5 Veto 236.95+/- 0.2 Hz F5 893.63 Hz F5 Veto Luca Taffarello
F5 Ada lck psp plugin @ 236.95+/- 0.2 Hz amplitude F5 Threshold veto F5 Veto Luca Taffarello
First hardware up-grade: rubber layer of Sylodamp (Angst Pfister) Starting new run 2 Dec. 2004 Previous position Position control feed-back lift used with the liquid helium inside the dewars Luca Taffarello
AURIGA Events [no vetoes] SNR Italian Holiday Luca Taffarello
AURIGA Events [with vetoes] SNR Is possible to apply the epoch vetoes and the result is a duty cycle 60 % Luca Taffarello
AURIGA Events [with vetoes & prob>0.00001] SNR a test of consistency about the shape of the burst Luca Taffarello
AURIGA Events [with vetoes & prob>0.00001] Amplitude Good stability of the detector in absolute amplitude Luca Taffarello
SNR Distribution (with vetoes) (Simulation/Red) 3 events with SNR >10 during 9 days SNR Luca Taffarello
Last hardware up-grade:external suspensions low frequency and with vibrational damping Air springs: effective above1-2 Hz Luca Taffarello
Metal-arc welding with liquid helium inside the dewarswithout bias in the trasducer A kind of “wings” to support Auriga above the center of mass of the cryostat Luca Taffarello
Low frequency suspensions installed (May 19th) Final configuration Ferroconcrete Pillar Luca Taffarello
Low frequency suspensions installed (May 19th) suspension activation Luca Taffarello
Before the up-grade AFTER! Also during the day Luca Taffarello
before after Low frequency suspensions installed (May 19th) Not so evident and dramatic the isolation effect, but impressive the effect in the data! in the best case 1 order of magnitude in amplitude Luca Taffarello
Perfect Gaussian and stationarybehaviour, duty cycle > 98% Luca Taffarello