Download
1 / 26
280 likes | 291 Vues
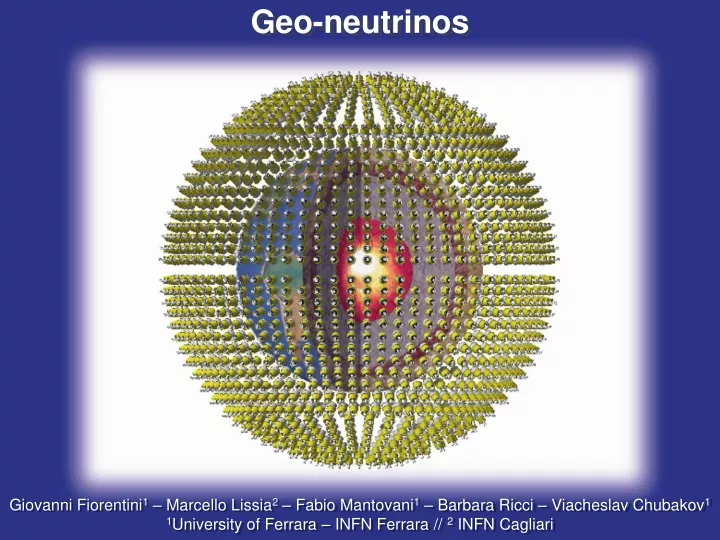
Geo-neutrinos. Giovanni Fiorentini 1 – Marcello Lissia 2 – Fabio Mantovani 1 – Barbara Ricci – Viacheslav Chubakov 1 1 University of Ferrara – INFN Ferrara // 2 INFN Cagliari. Summary. What are geo-neutrinos? Why are they of interest? What has occurred in the last year? What next?.

E N D
Geo-neutrinos Giovanni Fiorentini1 – Marcello Lissia2 – Fabio Mantovani1 – Barbara Ricci – Viacheslav Chubakov11University of Ferrara – INFN Ferrara // 2 INFN Cagliari
Summary • What are geo-neutrinos? • Why are they of interest? • What has occurred in the last year? • What next?
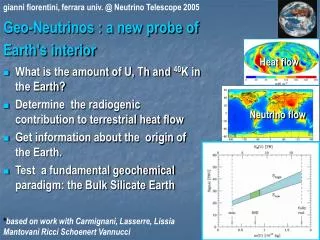
Geo-neutrinos: anti-neutrinos from the Earth U, Th and 40K in the Earth release heat together with anti-neutrinos, in a well fixed ratio: • Earth emits (mainly) antineutrinos whereas Sun shines in neutrinos. • A fraction of geo-neutrinos from U and Th (not from 40K) are above threshold for inverse b on protons: • Different components can be distinguished due to different energy spectra: e. g. anti-n with highest energy are from Uranium. • Signal unit: 1 TNU = one event per 1032 free protons per year
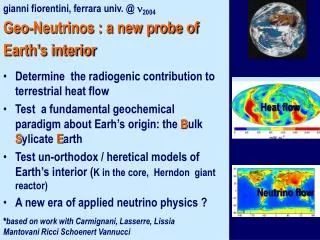
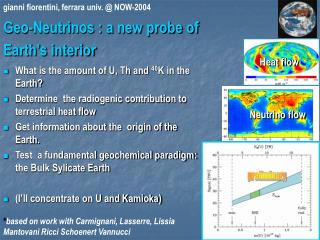
Open questions about natural radioactivity in the Earth 1 - What is the radiogenic contribution to terrestrial heat production? 2 - How much U and Th in the crust and in the mantle? 3 – A global check of the standard geochemical model (BSE)? 4 - What is hidden in the Earth’s core? (geo-reactor, 40K, …) The top 25 big questions facing science by 2030 How does Earth’s interior work? Geo-neutrinos: a new probe of Earth's interior • They escape freely and instantaneously from Earth’s interior. • They bring to Earth’s surface information about the chemical composition of the whole planet.
“Energetics of the Earth and the missing heat source mystery” * • The debate about the terrestrial heat flow is still open: HEarth = ( 31 - 46 )TW • The BSE canonical model, based on cosmochemical arguments, predicts a radiogenic heat production~ 20 TW Radioactive sources in Crust [7 TW] Mantle cooling [18 TW] Radioactive sources in Mantle [13 TW] Tidal dissipation - Gravitation energy [0.4 TW] Heat from core [8 TW] * D. L.Anderson (2005),Technical Report, www.MantlePlume.org **Jaupart, C. et al. - Treatise on Geophysics, Schubert G. (ed.), Oxford :Elsevier Ltd., 2007.
Geo-neutrinos born on board of the Santa Fe Chief train In 1953 G. Gamow wrote to F. Reines: “It just occurred to me that your background may just be coming from high energy beta-decaying members of U and Th families in the crust of the Earth.” F. Reines answered to G. Gamow: “Heat loss from Earth’s surface is 50 erg cm−2 s−1. If assume all due to beta decay than have only enough energy for about 108 one-MeV neutrinos cm−2 and s.”
An historical perspective Eder (1966)●Marx (1969)●Kobayashi (1991)●All above assumed an uniform U distribution in the Earth, Krauss et al. (1984) ●distributed U uniformly in the crust. Raghavan et al. (1998) ▲ and Rothschild (1991) ● studied the potential of KamLAND and Borexino for geo-neutrino detection. Mantovani et al. (2004) ■ discussed a reference model for geo-neutrinos and its uncertainties.
Geo-n: predictions of the BSE Reference Model Different authors calculated the geo-n signals from U and Th over the globe by using a 2°x2° crustal model (Laske G. – 2001) and a canonical BSE model: • All calculations in agreement to the 10% level • Different locations have different contributions from radioactivity in the crust and in the mantle • 1 TNU = one event per 1032 free protons per year * All the calculation are normalized to a survival probability <Pee> = 0.57
Nutel09 -> Nutel11: two years of gifts Mueller et al. 2011Improved estimates of reactor flux KamLAND June 2010 New results 6-8 October 2010Neutrino GeoScience Borexino March 2010 - New results
News about reactor antineutrinos • For a geo-neutrino experiment, reactors are important since: • - One can calibrate the experiment with reactor in the HER • - One has to subtract their contribution in LER • An improved world wide calculation of reactor antineutrinos is in progress by using updated IAEA data (reactor type, monthly load factor, thermalpower, electrical capacity, fuel enrichment...). • The recent estimate of reactor spectra (Mueller et al. 2011) increases the signal in LER and HER for ~ 3 %, intersting but negligible with respect to statistical errors and geological uncertainties • How many antineutrinos in Japan? Reactors have been switched on/off in Japan: • as a consequences of Noto earthquake (2006) the signal in KamLAND decrease by 38% with respect to 2006 • some reactor restarted in 2009, • the shutdown for Senday earthquake (2011) will compensate .
Nuclear power plants and earthquakes Senday earthquake 2011 Kashiwazaki(7 cores): 2 cores restarted in 2009 Noto earthquake 2007 Shika (2 cores): restarted in 2009 Predicted reactor signal in KamLAND is back to the post Noto earthquake
The Reference Model for Gran Sasso • Our 2004 world wide reference model (16200 2°x2° tiles) predicts for Borexino: • The contribution of the 6 tiles near Borexino was found (Ref. Mod.) as: • A 2°x2° tile centered at Gran Sasso gives: The regional contribution has to be controlled/determined by study of regional geology, if one wants to extract the global information brought in by geo-n’s
Refined Reference Model (RRM) for Borexino* • We built a 3D model of the central tile with the data constraints of CROP seismic sections and 38 deep oil and gas wells. • We measured the U and Th content in 57 samples of rock from sediments, upper and lower crust. • The main point is that a thick (~13 km) sedimentary layer (poor in U and Th) around Gran Sasso had been washed out in the 2° x 2° crustal map. * arXiv:1102.1335v1 – Coltorti et al. 2011 - In press on Geochimica et Cosmochimica Acta.
Borexino: expectations and results (2010)* • Observe 21 events in 24 months, attributed to • R=10.7 -3.4+4.3 • G= 9.9 -3.4+4.1 • BK=0.4 • One geo-n event per month experiment! • RRM Predicts a total of 20.0 events in 24 months • (R=14.0 ; G=5.6 ; Bk=0.4) • The HER can be used to test the experiment sensitivity to reactors • In the LER one expects comparable number of geo-n and reactor-n LER HER *Physics Letters B 687 (2010)
Borexino (2010): geological implications region allowed by BSE: signal between 29 and 42 TNU region containing all models consistent with geochemical and geophysical data • The signal observed in Borexino is: • S = 64.8+26.6-21.6 TNU • Geo-n = 0 is excluded with C.L. of 99.997 (corresponding to 4s) • The central value is close to the fully radiogenic model and some 1s from the BSE prediction The graph is site dependent: • the “slope” is universal • the intercept depends on the site (crust effect) • the width depends on the site (crust effect)
KamLAND results (2010) • KamLAND collaboration presented new data at Neutrino 2010,with a background much smaller than in previous releases. • From March 2002 to November 2009 a total 841 events in the LER have been collected: R = 485 ± 27 13C(a,n)16O = 165 ± 18 BK = 80 ± 0.1 With rate-only analysis: Geo n= 111 -43+45
KamLAND 2010 and BSE • By using rate-shape-time analysis, the signal is: • S = 38.3 -9.9+10.3 TNU • The best fit (bf) is: • close to the BSE prediction model • some 2.5s from fully radiogenic model • to be compared with the expected signal (Fiorentini et al. 2005) for BSE • S(U+Th) = 36.9 ± 4.3 TNU
Implications of KamLAND on terrestrial radiogenic heat • Assume models were “exact”:SKamLAND = 38 ± 10 TNU -> H(U+Th) = 16 ± 8 TW • Assume a perfect experiment, giving 38 TNU with zero error;the geological uncertainty is: Dgeo = ± 5 TW • The result is • H(U+Th) = 16 ± 8 TW (exp) ± 5 TW (geology) • For the first time we have a measurement of the terrestrial heat power from U and Th
Baksan Homestake What is next? Running and planned experiments • Several experiments, either running or under construction or planned, have geo-n among their goals. • Figure shows the sensitivity to geo-neutrinos from crust and mantle together with reactor background.
SNO+ at Sudbury • A 1000-ton liquid scintillator underground detector, obtained by replacing D2O in SNO. • The SNO collaboration has planned to fill the detector with LS. SNO+ will start data taking in early 2011. • 80% of the signal comes from the continental crust. • From BSE expect 28 – 38 events/year* • It should be capable of measuring U+Th content of the crust. * assuming 80% eff. and 1 kTon CH2 fiducial mass Chen, M. C., 2006, Earth Moon Planets 99, 221. Progress in Particle and Nuclear Physics 64 (2010)
Effect of earthquarkes on reactor signal • After the earthquake 2007 the signal decreased of 38% respect 2006 • After the earthquake 2011 the signal decreased of 13% respect 2009 • After the earthquake 2011 the signal decreased of 38% respect 2006
KamLAND vs Borexino • KamLAND from 2002 to 2009 collected 841 events in the LER. • Most due to Reactors (485) and background (245) • After subtraction one remains with some 111 geo-n events, a > 4s evidence of geo-n. • Borexino has a smaller mass and exposure time • It benefits from: • much higher purity • absence of nearby reactors
Reactor anti neutrinos in the world TNU • The signal refers to LER and it is calculated with the monthly load factor in the period 2007-2009 (IEAE data 2010). • For the estimation of the neutrino flux from spent fuel (En < 3.54 MeV) we assume that all spent fuels are stored just beside the reactors; the contribution to signal in LER is ~ 1%. • By using the improved prediction of reactor antineutrinos spectra (Mueller et al. 2011) the signal in the LER increase of ~ 3 %.