Download
1 / 22
220 likes | 300 Vues
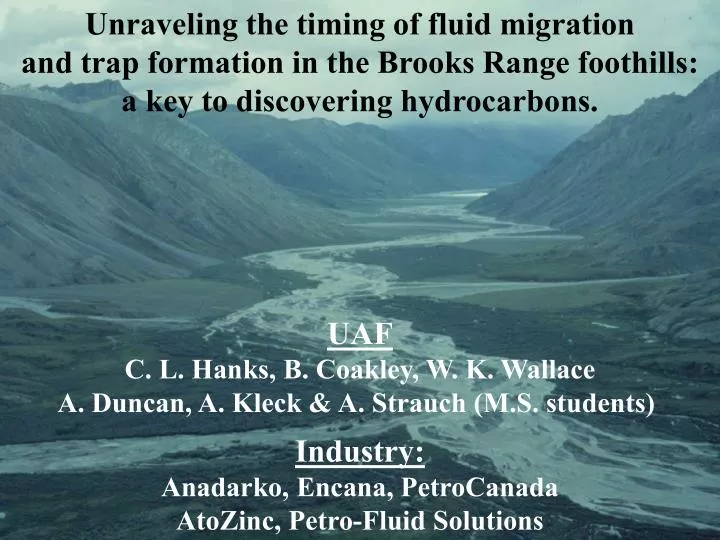
Unraveling the timing of fluid migration and trap formation in the Brooks Range foothills: a key to discovering hydrocarbons. UAF C. L. Hanks, B. Coakley, W. K. Wallace A. Duncan, A. Kleck & A. Strauch (M.S. students) Industry: Anadarko, Encana, PetroCanada AtoZinc, Petro-Fluid Solutions.

E N D
Unraveling the timing of fluid migration and trap formation in the Brooks Range foothills: a key to discovering hydrocarbons. UAFC. L. Hanks, B. Coakley, W. K. Wallace A. Duncan, A. Kleck & A. Strauch (M.S. students) Industry:Anadarko, Encana, PetroCanadaAtoZinc, Petro-Fluid Solutions
Goals of project • Constrain the conditions & timing of the development of hydrocarbon migration pathways & reservoir enhancement (fractures) in the foothills of the Brooks Range. • Collect real data sets to constrain broader theoretical and regional models.
Goals of project • Constrain the conditions & timing of the development of hydrocarbon migration pathways & reservoir enhancement (fractures) in the foothills of the Brooks Range. • Collect real data sets to constrain broader theoretical and regional models.
Methods • Collect surface data that focuses on the relationship of fractures to structure and stratigraphic position. • Integrate detailed surface geologic data with subsurface seismic and well data along two representative transects. • Develop a regional picture of in situ stress distribution • Develop integrated model of fracture distribution in space and time.
Results to date iv • There are four different episodes of fracturing. Fracturing occurred under different conditions and from different causes.
Results to date iv Not all stratigraphic units are affected by all four events.
Results to date iv Not all fractures record the presence of fluids.
Results to date Integration of structural geometry, fracture distribution and geochronologic data yields a qualitative picture of where and when fractures developed that explain these variations in fracture distribution. Cross sections by A. Duncan
Results to date Further refinement of these qualitative models using seismic data, thermal data and conservation of area principles allow a quantitative model of the evolution of the Brooks Range foothills over time. Seismic data provided by Western Geophysical; interpretations by A. Duncan
Results to date Determining how much material has been eroded in any one location allows refinement of where petroleum generation may or may not have occurred. eroded Cross sections by A. Duncan using LithoTect software
Results to date iv • The fractures most likely to be effective migration conduits are those that form during hydrocarbon generation
Results to date Set 1 fractures probably formed parallel to maximum compressive stress, in the foreland of the fold-and-thrust belt. Where s1 > s2≥ s3; s2 & s3 = overburden
Results to date • Consequently: • Predicting the orientation of the maximum horizontal stress can predict orientation of set 1 fractures. • Depth of fracturing is in part a function of overburden Where s1 > s2≥ s3; s2 & s3 = overburden
Results to date Orientation of Shmax by A. Kleck
Results to date Orientation of Shmax by A. Klek
Results to date Breakout length (m) Sv (Mpa) Set 1 fractures will only occur when horizontal stress exceeds the vertical stress. The longest borehole breakouts occur in three Sv ranges: - ~ 15 – 35 MPa - ~70 – 100 MPa - ~ 115 – 135 MPa 14 wells, 130 data points
Results to date • Largest number of breakouts occur in similar SV ranges. • - ~20-25 MPa • - ~ 80 MPa • - ~120 Mpa Due to unconsolidated sediments? Due to overburden and/or stratigraphy?
Plans for next year • Complete quantitative model for each transect • Complete regional stress study, including: • relationship of stratigraphy to Set 1 fractures • a map of regional Sv distribution • a map to depth of critical Sv. • Prepare results for publication.