Download
1 / 57
570 likes | 648 Vues
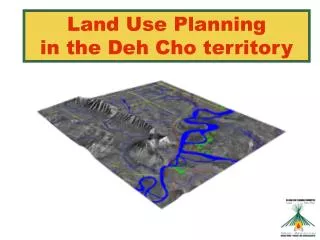
Orientation: Cumulative Effects Assessment in the Cariboo. Cumulative Effects:. “Changes to the environmental , social and economic values” “Caused by the combined effect of past, present and proposed activities and events.”. Provincial Context . Pilot projects : Thompson – Okanagan

E N D
Cumulative Effects: • “Changes to the environmental, social and economic values” • “Caused by the combined effect of past, present and proposed activities and events.”
Provincial Context Pilot projects: • Thompson – Okanagan • Skeena • Peace Cariboo Project: • 2010 – 2014 • response to William case • 3rd Iteration
Implementation Considerations • Screening, decision support and planning • Assess risk based on all developments • Use broad scale assessment units • Work in progress: β release
Inputs and Outputs • Existing Information: science and expert opinion • GIS queries • Maps and risk tables provided • Layered approach (risk tables, maps)
Transparency • Complete information is available in full report. • Model details • Indicator formulas • Weighting factors • Indicator ratings
Principles: Ecological Assessment Framework Biophysical Assessment Socio economic Assessment
. Principles: Scale Landscape, not site...but may inform site level decisions
Principles: Scale • Scale – multi landscape • Wildlife values: units 15,000 to 30,000 ha (approximately 350 units in region) • Hydrology: watersheds, basins, sub-basins • Mule deer: winter range
Assessment focus on current land condition Future developments can be added but forest estate does not grow Principles: Current and Future Conditions Now Future Proposal
Principles: Habitat • Habitat, not population
. Principles: Key Habitat Attributes Example moose assessment focus is winter habitat – selected components of habitat
Principles: Wildlife Habitat Concept Relationships Seral condition Habitat Capability Habitat Suitability Habitat Effectiveness Access
Values Coarse Filter • Hydrological Stability • Forest Biodiversity Wildlife Species • Moose • Marten • Deer • Grizzly Bear
Values Assessment • Hydrological Stability: Watershed processes and fish values • Forest Biodiversity: landscape scale forest structure and spatial distribution • Moose –Habitat interspersion, road location • Marten- Mature forest amount and distribution • Deer – Forest structure • Grizzly Bear – Access density, un-roaded areas and habitat quality including salmon availability.
Risk Assessment Tables: Components • Ecological Importance • Sensitivity and Hazards • Current Mitigation RISK = likelihood x consequence
Products: Assessment Tables Components
Products: Interpretive Maps Moose winter habitat Road density classes for Grizzly Bear
Products: Support Maps CCLUP designated areas Stand mortality from MPB
Products: Interpretations Example:Hydrology: “The Upper Chilko basin shows a very high sensitivity to factors affecting sediment delivery. However the hazard rating is currently very low because of the lack of the type of development activities which would affect sediment delivery.”
CEA Application • Identifies areas with concentrations of valuable habitat • Hazard ratings identify broad areas of concern requiring more planning at site or landscape level or more careful consideration in authorizations • Identifies specific factors in need of mitigation eg. Roads vs harvest impacts
ftp://ftp.geobc.gov.bc.ca/publish/Regional/WilliamsLake/cumulative_effectsftp://ftp.geobc.gov.bc.ca/publish/Regional/WilliamsLake/cumulative_effects
ftp://ftp.geobc.gov.bc.ca/publish/Regional/WilliamsLake/cumulative_effectsftp://ftp.geobc.gov.bc.ca/publish/Regional/WilliamsLake/cumulative_effects
Example: Moose Assessment - Indicators * Habitat changes based on comparison of current and unharvested landscape habitat suitability
Hydrological Stability • Multi-scale assessment • Ecological importance is assessed in relation to fish value of habitat • Hazard and sensitivity assessed for two processes: 1)stream flow and 2)sedimentation • Current mitigation provided by CCLUP no-harvest and modified harvest designations
Hazard vs Sensitivity Sensitivity – effects of natural watershed characteristics on hydrological process Hazard • Incorporates land use factors such as Equivalent Clear-cut Area (ECA) and roads • Uses a sliding scale where less sensitive hydrological units can absorb more roads and logging before showing high hazard
Runoff Generation Hazard Rating VL L M H VH VH VL L M H VH H Runoff Generation Sensitivity VL L M H VH M VL L M H VH L VL L M H VH VL 40 60 80 100 0 20 Equivalent Clearcut Area (ECA)
Ecological Importance • Fish Use • Key Fish Species: • bull troutcohochinookrainbow troutlake troutsockeyepink salmonchum salmonkokaneeburbotwhitefish • Sensitive Species: Bull Trout, Coho
Maps- Basin Sensitivity + Hazard Sensitivity Hazard
Quality of CE Assessment • Expert input to initial development • Peer review and expert input on technical content – ongoing • Validation using local data - ongoing • User input on utility – ongoing
Quality of Interpretations • Quality of interpretations depends on: • Information quality and presentation • What each interpreter brings to the process • Help to do quality interpretations: • Community of Practise • User’s Guide
Next Steps • Complete biodiversity assessment • Ongoing refinements and updates • Implementation - through CoP • Integration with provincial pilots