Download
1 / 49
750 likes | 1.29k Vues
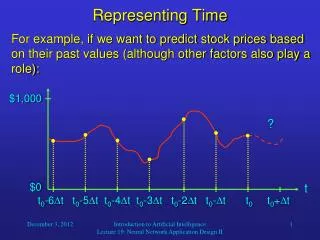
Representing Motion . Chapter 2 ( pg 30-55). Do Now. Why is it important to describe and analyze motion ? How fast? How far? Slowing/Speeding? Rest/Constant velocity What are some of the different types of motion ? Translational – motion along a straight line

E N D
Representing Motion Chapter 2 (pg 30-55)
Do Now • Why is it important to describe and analyze motion? • How fast? • How far? • Slowing/Speeding? • Rest/Constant velocity • What are some of the different types of motion? • Translational – motion along a straight line • Circular – motion along a circular path • Rotational – Rotation about a fixed point
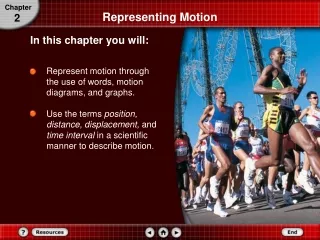
Chapter Objectives • Represent motion through the use of words, motion diagrams, and graphs. • Use the terms position, distance, displacement, and time interval in a scientific manner to describe motion.
Motion • Motion is instinctive • Eyes will notice moving objects more readily than stationary ones • Object changes position • Motion can occur in many directions and paths
(2.1)Picturing Motion (2.2) Where and When? • Analyze motion diagrams to describe motion. • Develop a particle model to represent a moving object. • Define coordinate systems for motion problems and recognize that it affects the sign of an object’s position. • Define displacement. • Use a motion diagram to answer questions about an object’s position or displacement.
TIME PLACE Picturing Motion • A description of motion relates to a PLACE and TIME. • Answers the questions WHERE? and WHEN?
Motion Diagrams • Series of images showing the positions of a moving object at equal time intervals.
Particle Model • Simplified version of a motion diagram in which the object in motion is replaced by a series of single points. • Size of object much less than the distance moved • Internal motions of object ignored
Practice • Draw a particle model for the motion diagram above of a car coming to a stop.
Describe the motion of the bird… Draw a particle model….
Use the particle model to draw motion diagrams for two runners in a race. When the first runner crosses the finish line, the second runner is ¾ of the way to the finish line. • First Runner • Second Runner Must have same number of particles to represent equal time.
How are the two particle models different? Describe the motion of each. A. B. • Eight time intervals & Constant velocity (equal spacing) • Five time Intervals & speeding up (spacing is getting farther)
Which statement describes best the motion diagram of an object in motion? A. a graph of the time data on a horizontal axis and the position on a vertical axis B. a series of images showing the positions of a moving object at equal time intervals C. a diagram in which the object in motion is replaced by a series of single points D. a diagram that tells us the location of the zero point of the object in motion and the direction in which the object is moving
What is the purpose of drawing a motion diagram or a particle model? A. to calculate the speed of the object in motion B. to calculate the distance covered by the object in a particular time C. to check whether an object is in motion D. to calculate the instantaneous velocity of the object in motion
Coordinate System • Tells you the location of the zero point of the variable you are studying and the direction in which the values of the variable increase. • ORIGIN • The point at which both variables have the value zero
Coordinate System • Motion is RELATIVE • You can define a coordinate system any way you want, but some are more useful than others.
Coordinate systems • This coordinate system works as well but is not as convenient to use as the first one. • Try to always pick your origin where motion begins. Axis of the coordinate system
Position & Distance • You can indicate how far an object is from the origin by drawing an arrow from the origin to the point representing the object. • The two arrows indicate the runner’s POSITION at two different times. (vector) • Separation between an object and the origin • The length of how far an object is from the origin indicates DISTANCE. (scalar)
A. 3 m B. 8 m C. 5 m D. 5 cm Refer to the figure and calculate the distance between the two signals?
Tip Tail Vectors & Scalars • SCALARS: quantities that are just numbers without any direction • Magnitude (number) only • Examples: time, volume, mass, temperature • VECTORS: quantities that have both magnitude (size) and direction • Represented by arrows • Examples: velocity, acceleration, force, momentum
Vector Addition: Tail to Tip • Just like you can add scalars, you can also add vectors. • Algebraically (look at later) & Graphically • Place vectors tail to tip • Place the tail of the 2nd vector next to the tip of the 1st vector • RESULTANT - the vector that represents the sum of two or more other vectors • is drawn from the tail of the first vector to the tip of the last vector.
Vector 1 Vector 2 Vector 3 Example: Add the three vectors
Vector 1 Vector 1 Vector 2 Vector 2 RESULTANT RESULTANT Vector 3 Vector 3 Resultant Like scalars, vectors can be added in different order and still have the same resultant.
Distance vs. Displacement • DISTANCE • Actual length traveled • Scalar measurement • Path dependent • DISPLACEMENT • Change in position • Vector measurement • Path independent • ∆x = xf– xi
Distance vs. Displacement • Find distance and displacement for the following races:
Practice Ex: Jared walks 75 m down the block heading east when he realizes he dropped his book. He turns around and walks 15 m until he finds his book. • Draw vectors to represent Jared’s motion. • Find the distance that Jarred walked. • Find Jared’s displacement.
What is displacement? • A. the vector drawn from the initial position to the final position of the motion in a coordinate system • B. the distance between the initial position and the final position of the motion in a coordinate system • C. the amount by which the object is displaced from the initial position • D. the amount by which the object moved from the initial position
Ch. 2.3 Objectives • Develop position-time graphs for moving objects. • Use position-time graphs to interpret an object’s position or displacement. • Make motion diagrams, pictorial representations, and position-time graphs that are equivalent in describing an object’s motion.
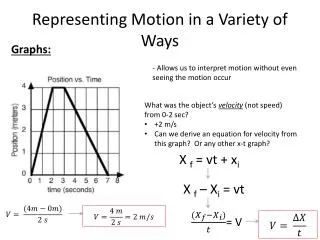
Graphs • Named as y-axis vs. x-axis • Also as Dependent vs. Independent • Ex. Position vs. time • Place position on the y-axis and time on the x-axis Always play close attention to the units. Units are key to analyzing graphs…
Analyzing Graphs Slope: Look at the units of the slope to see if it corresponds to a measurement. Area: look at the units for the area under the curve to see if it corresponds to a measurement.
Position-Time Graphs Where? & When? SLOPE: Rise/Run m = Velocity y-axis Dependent Variable x-axis: Independent variable Area (m*s) No Meaning
From the following position-time graph of two brothers running a 100-m dash, at what time do both brothers have the same position? At what position? At about 6 seconds At about 60 meters
Position-Time Graphs • When does runner B pass runner A? • 45 seconds into the race • Where does runner B pass runner A? • 190 m
Position-Time Graphs • What is the displacement of the runner between 5 s and 10 s? 10 m
A. C. B. D. What is happening in each?
Position-Time Graph - SLOPE • Analyze the units • Slope = rise over run • m = ∆y / ∆x • Slope = m / s • m/s is the unit for velocity • The slope of a position-time graph is the average velocity
Position-Time Graph - AREA • Analyze units only • Area under the curve • Area of a triangle A = ½ b * h • ½ is a constant and has no units • Base has units of time (s) • Height has units of position (m) • Area = (m)(s) • We do not have any measurements that have the units (s)(m): thus the area of a position-time graph does not have any meaning.
Ch. 2.4 Objectives • Define Velocity • Differentiate between speed and velocity • Create pictorial, physical, and mathematical models of motion problems
Average Velocity • Defined as the change in position, divided by the time during which the change occurred. • How fast in a given direction? • Vector quantity • Same direction as the displacement (Δx)
Average Speed • The absolute value of the slope of a position-time graph. • It describes how fast the object is moving.
Instantaneous Velocity • Velocity at a given instant • Slope of the line drawn on the x-t graph at the given instant • Need calculus to find unless object moving at a constant velocity
Velocity vs. Speed • Speed is the distance divided by the time during which the distance was traveled. • Scalar (No direction)
Position-Time Graphs - Velocity Suppose you recorded two joggers in one motion diagram, as shown in the figure above. From one frame to the next, you can see that the position of the jogger in red shorts changes more than that of the one wearing blue. What would the x-t graph look like if they both started at the same time?
Position-Time Graphs • You can create a position-time graph if you know the position and time of the joggers at different points. • Need a minimum of two data points in order to create a x-t graph.
Position-Time Graphs (velocity) • Can find the velocity of each jogger by calculating the slope of the line. • Red Jogger • v = m = (6m – 2 m)/ (3s – 1s) • v = 2 m/s • Blue Jogger • v = m = (3m – 2m) / (3s – 2s) • v = 1 m/s
What is happening? 1 - Compare the velocities for each of the segments. 2- Rate the segments in increasing speed.