Download
1 / 22
220 likes | 319 Vues
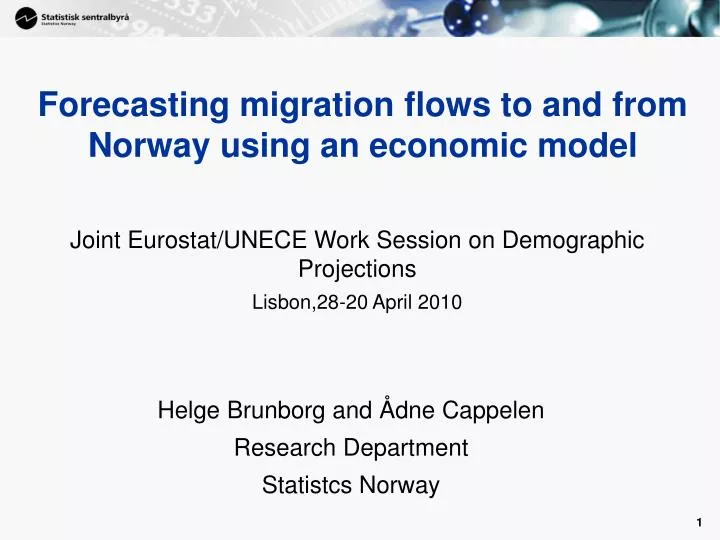
Forecasting migration flows to and from Norway using an economic model. Joint Eurostat/UNECE Work Session on Demographic Projections Lisbon,28-20 April 2010. Helge Brunborg and Ådne Cappelen Research Department Statistcs Norway. Migration to and from Norway, 1970-2008.

E N D
Forecasting migration flows to and from Norway using an economic model Joint Eurostat/UNECE Work Session on Demographic Projections Lisbon,28-20 April 2010 Helge Brunborg and Ådne Cappelen Research Department Statistcs Norway
Migration to and from Norway, 1970-2008 Rapid growth: Net immigration quadrupled in 4 years
Registered and projected net immigration to Norway Immigration Projections Emigration Net immigration
Migration of Polish citizens to and from Norway Immigration Net immigration of Polish citizens 2003: 300 2007: 13 000 Net immigration Emigration
Migration of Icelandic citizens between Iceland and Norway Thick lines: Statistics Norway Thin lines: Statistics Iceland Iceland Norway Net Norway Iceland
Norwegian economy • Rapid economic growth due to oil and gas in the North Sea • Most of the revenue from the North Sea invested in The Government Pension Fund - Global • In 2007 the GDP per capita in Norway 76% higher than in OECD • Low unemployment, 2-4% in recent years • High demand for labour in the construction sector • Norway also hit by the financial crisis, but is recovering
Migration theories • People migrate when the expected income is greater than the current income, less migration costs (Todaro) • Individual migration behavior is guided by the search for better economic opportunities (Borjas)
Methods for projecting migration • A projection of population must rest, in part, on a projection of immigration. Yet most official immigration projections … rely on ad-hoc assumptions based on little theory and virtually no definable methodology (Howe and Jackson 2006) • Official statistical agencies: Mostly trend extrapolation • A few other attempts (Australia <–> New Zealand; British Columbia) • EUROPOP 2008: net migration flows between member countries will convergence linearly to zero in the convergence year ( 2150)
Theoretical framework Migration from country of origin (o) to country of destination (d) is a function of individual observables and unobservable characteristics: ln wo = μo + εo where εo ~ N (0, σo2) ln wd = μd + εd where εd ~ N (0, σd2) Decision to migrate: I = ln (wd/(wo + c)) ≈ (μd - μo - δ ) + εd - εo c and δ: level of mobility costs. Migration if I > 0 Probality of emigration from country o to country d: P = Pr (εd - εo > - (μd - μo - δ ))
Empirical analysis Gross flows between Norway and • Denmark • Sweden • OECD countries • Asia and Africa For Sweden and Denmark: lnMij = a0 + a1 ln (incomei/incomej) + a2 Ginii + a3Ui + a4Uj + a5lnMjj t-1
Sweden Norway Denmark Norway
Estimation of the rate of migration from groups of countries to Norway
Modelling immigration from Europe and America by OLS, 1972 – 2008, to be used in projections Dependent variable: LnMt Coefficient Std.Error t-value Constant 1.101 0.566 1.95 LnMt-1 0.565 nn.081 6.98 Dummy1993 0.312 0.070 4.46 Dummy1999 0.162 0.073 2.21 Dummy2005 0.166 0.052 3.21 UnNORt - UnNORt-2 -0.062 0.013 -4.82 LnGDPNort-2 0.669 0.152 4.40 UnOECDt – UnOECD t 0.034 0.023 1.49 R2 = 0.96 F = 108.5
Gross and net migration flows to Norway History and forecasts
Net immigration to NorwayRegistered 1990-2009 and projected 2009-2060
Migration from and to EU and other Western countries Estimated on data for 1966-2009 Immigration Net immigration Emigration
Migration from and to non-Western countries:non-EU Eastern Europe, Africa, Asia, Latin-America, Oceania except Australia and New Zealand Estimated on data for 1966-2009 Immigration Net immigration Emigration
Total migration to and from Norway Estimated on data for 1966-2009 Immigration Net immigration Emigration