Download
1 / 67
670 likes | 854 Vues
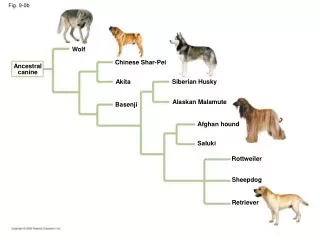
Fig. 9-0a. Fig. 9-0b. Wolf. Chinese Shar-Pei. Ancestral canine. Akita. Siberian Husky. Alaskan Malamute. Basenji. Afghan hound. Saluki. Rottweiler. Sheepdog. Retriever. Fig. 9-2a. Fig. 9-2b. Petal. Stamen. Carpel. White. Removed stamens from purple flower. 1. Fig. 9-2c-1.

E N D
Fig. 9-0b Wolf Chinese Shar-Pei Ancestral canine Akita Siberian Husky Alaskan Malamute Basenji Afghan hound Saluki Rottweiler Sheepdog Retriever
Fig. 9-2b Petal Stamen Carpel
White Removed stamens from purple flower 1 Fig. 9-2c-1 Stamens Carpel Transferred pollen from stamens of white flower to carpel of purple flower 2 Parents (P) Purple
White Removed stamens from purple flower 1 Fig. 9-2c-2 Stamens Carpel Transferred pollen from stamens of white flower to carpel of purple flower 2 Parents (P) Purple Pollinated carpel matured into pod 3
White Removed stamens from purple flower 1 Fig. 9-2c-3 Stamens Carpel Transferred pollen from stamens of white flower to carpel of purple flower 2 Parents (P) Purple Pollinated carpel matured into pod 3 Planted seeds from pod 4 Offspring (F1)
Flower color Purple White Fig. 9-2d Flower position Axial Terminal Seed color Green Yellow Seed shape Wrinkled Round Pod shape Inflated Constricted Green Pod color Yellow Tall Stem length Dwarf
P generation (true-breeding parents) Purple flowers White flowers Fig. 9-3a-1
P generation (true-breeding parents) Purple flowers White flowers Fig. 9-3a-2 F1 generation All plants have purple flowers
P generation (true-breeding parents) Purple flowers White flowers Fig. 9-3a-3 F1 generation All plants have purple flowers Fertilization among F1 plants (F1´ F1) F2 generation of plants have purple flowers of plants have white flowers 1 – 4 3 – 4
Genetic makeup (alleles) P plants pp PP Fig. 9-3b Gametes All All p P F1 plants (hybrids) All Pp p P 1 – 2 1 – 2 Gametes Sperm p P P PP Pp F2 plants Phenotypic ratio 3 purple : 1 white Eggs Genotypic ratio 1 PP : 2 Pp : 1 pp Pp pp p
Gene loci Dominant allele Fig. 9-4 B a P b P a Recessive allele Bb PP Genotype: aa Homozygous for the recessive allele Heterozygous Homozygous for the dominant allele
Hypothesis: Independent assortment Hypothesis: Dependent assortment rryy P generation rryy RRYY RRYY Fig. 9-5a ry ry Gametes RY Gametes RY RrYy F1 generation RrYy Sperm Sperm RY 1 – 4 Ry ry 1 – 4 1 – 4 1 – 4 rY ry RY 1 – 2 1 – 2 RY 1 – 4 F2 generation RY 1 – 2 RrYy RRYY RrYY RRYy Eggs 1 – 4 rY ry 1 – 2 RrYY rrYY RrYy rrYy Eggs Yellow round 9 –– 16 Ry 1 – 4 RRYy RRyy Rryy RrYy Green round 3 –– 16 1 – 4 ry Hypothesized (not actually seen) Yellow wrinkled Rryy rrYy rryy 3 –– 16 RrYy Actual results (support hypothesis) Green wrinkled 1 –– 16
Fig. 9-5b Blind Blind Chocolate coat, normal vision bbN_ Black coat, normal vision B_N_ Black coat, blind (PRA) B_nn Phenotypes Genotypes Chocolate coat, blind (PRA) bbnn BbNn Mating of heterozygotes (black, normal vision) BbNn 9 black coat, normal vision 3 black coat, blind (PRA) 3 chocolate coat, normal vision 1 chocolate coat, blind (PRA) Phenotypic ratio of offspring
Fig. 9-6 Testcross: B_ Genotypes bb Two possibilities for the black dog: BB Bb or B b B Gametes b Bb b Bb bb Offspring 1 black : 1 chocolate All black
F1 genotypes Bb male Formation of sperm Fig. 9-7 Bb female Formation of eggs B b 1 – 2 1 – 2 B B b B B 1 – 2 1 – 4 1 – 4 b b b B b 1 – 2 1 – 4 1 – 4 F2 genotypes
Recessive Traits Dominant Traits Fig. 9-8a Freckles No freckles Widow’s peak Straight hairline Attached earlobe Free earlobe
Fig. 9-8aa Freckles No freckles
Fig. 9-8ab Straight hairline Widow’s peak
Fig. 9-8ac Free earlobe Attached earlobe
First generation (grandparents) Ff Ff Ff ff Fig. 9-8b Second generation (parents, aunts, and uncles) ff Ff ff Ff ff FF or Ff Third generation (two sisters) ff FF or Female Male Ff Affected Unaffected
Parents Normal Dd Normal Dd ´ Fig. 9-9a Sperm d D Dd Normal (carrier) DD Normal D Offspring Eggs Dd Normal (carrier) dd Deaf d
Chorionic villus sampling (CVS) Amniocentesis Needle inserted through abdomen to extract amniotic fluid Ultrasound monitor Suction tube inserted through cervix to extract tissue from chorionic villi Ultrasound monitor Fig. 9-10a Fetus Fetus Placenta Placenta Chorionic villi Uterus Cervix Cervix Uterus Centrifugation Amniotic fluid Fetal cells Fetal cells Biochemical tests Several weeks Several hours Karyotyping
P generation Red RR White rr Fig. 9-11a r R Gametes F1 generation Pink Rr 1 – 2 1 – 2 R r Gametes Sperm r R 1 – 2 1 – 2 F2 generation rR RR R 1 – 2 Eggs Rr rr r 1 – 2
Genotypes: Fig. 9-11b HH Homozygous for ability to make LDL receptors hh Homozygous for inability to make LDL receptors Hh Heterozygous Phenotypes: LDL LDL receptor Cell Normal Severe disease Mild disease
Fig. 9-12 Reaction When Blood from Groups Below Is Mixed with Antibodies from Groups at Left Blood Group (Phenotype) Antibodies Present in Blood Red Blood Cells Genotypes O A B AB Anti-A Anti-B ii O IAIA or IAi Carbohydrate A Anti-B A IBIB or IBi B Carbohydrate B Anti-A IAIB AB —
Blood Group (Phenotype) Genotypes Red Blood Cells Fig. 9-12a O ii IAIA or IAi Carbohydrate A A IBIB or IBi B Carbohydrate B IAIB AB
Reaction When Blood from Groups Below Is Mixed with Antibodies from Groups at Left Blood Group (Phenotype) Antibodies Present in Blood B A AB O Fig. 9-12b Anti-A Anti-B O Anti-B A B Anti-A — AB
Individual homozygous for sickle-cell allele Sickle-cell (abnormal) hemoglobin Fig. 9-13 Abnormal hemoglobin crystallizes, causing red blood cells to become sickle-shaped Sickle cells Clumping of cells and clogging of small blood vessels Breakdown of red blood cells Accumulation of sickled cells in spleen Physical weakness Heart failure Pain and fever Brain damage Damage to other organs Spleen damage Anemia Impaired mental function Pneumonia and other infections Kidney failure Paralysis Rheumatism
P generation aabbcc (very light) AABBCC (very dark) Fig. 9-14 F1 generation AaBbCc AaBbCc Sperm 1 – 8 1 – 8 1 – 8 1 – 8 1 – 8 1 – 8 1 – 8 1 – 8 F2 generation 1 – 8 1 – 8 1 – 8 20 –– 64 1 – 8 Eggs 1 – 8 15 –– 64 1 – 8 Fraction of population 1 – 8 1 – 8 6 –– 64 1 –– 64 20 –– 64 6 –– 64 1 –– 64 1 –– 64 6 –– 64 15 –– 64 15 –– 64 Skin color
P generation aabbcc (very light) AABBCC (very dark) Fig. 9-14a F1 generation AaBbCc AaBbCc Sperm 1 – 8 F2 generation 1 – 8 1 – 8 1 – 8 1 – 8 1 – 8 1 – 8 1 – 8 1 – 8 1 – 8 1 – 8 1 – 8 Eggs 1 – 8 1 – 8 1 – 8 1 – 8 20 –– 64 6 –– 64 1 –– 64 1 –– 64 6 –– 64 15 –– 64 15 –– 64
20 –– 64 Fig. 9-14b 15 –– 64 Fraction of population 6 –– 64 1 –– 64 Skin color
All round yellow seeds (RrYy) F1 generation R y r Y Fig. 9-16-1 r R r R Metaphase I of meiosis (alternative arrangements) y Y y Y
All round yellow seeds (RrYy) F1 generation R y r Y Fig. 9-16-2 r R r R Metaphase I of meiosis (alternative arrangements) y Y y Y r R r R Anaphase I of meiosis y y Y Y r r R R Metaphase II of meiosis y y Y Y
All round yellow seeds (RrYy) F1 generation R y r Y Fig. 9-16-3 r R r R Metaphase I of meiosis (alternative arrangements) y Y y Y r R r R Anaphase I of meiosis y y Y Y r r R R Metaphase II of meiosis y y Y Y Gametes y Y Y y y y Y Y r r R r r R R R 1 – 4 1 – 4 1 – 4 Ry ry rY 1 – 4 RY Fertilization among the F1 plants F2 generation 9 :3 :3 :1
Experiment Purple flower PpLl PpLl Long pollen Fig. 9-17 Observed offspring Prediction (9:3:3:1) Phenotypes Purple long Purple round Red long Red round 284 21 21 55 215 71 71 24 Explanation: linked genes PL Parental diploid cell PpLl pl Meiosis Most gametes pl PL Fertilization Sperm PL pl PL PL PL Most offspring PL pl Eggs pl pl pl PL pl 3 purple long : 1 red round Not accounted for: purple round and red long
Experiment Fig. 9-17a Purple flower PpLl PpLl Long pollen Prediction (9:3:3:1) Observed offspring Phenotypes Purple long Purple round Red long Red round 284 21 21 55 215 71 71 24
Explanation: linked genes PL Parental diploid cell PpLl Fig. 9-17b pl Meiosis Most gametes pl PL Fertilization Sperm PL pl PL PL PL Most offspring PL pl Eggs pl pl pl PL pl 3 purple long : 1 red round Not accounted for: purple round and red long
Fig. 9-18a b A B A B A b a a B a b Tetrad Crossing over Gametes
Experiment Gray body, long wings (wild type) Black body, vestigial wings GgLl ggll Female Male Fig. 9-18c Offspring Black vestigial Gray vestigial Gray long Black long 944 185 965 206 Parental phenotypes Recombinant phenotypes 391 recombinants 2,300 total offspring = 0.17 or 17% Recombination frequency = Explanation g l G L ggll (male) GgLl (female) g l g l g l g l g L G L G l Sperm Eggs g l g L G L G l g l g l g l g l Offspring
Experiment Gray body, long wings (wild type) Black body, vestigial wings Fig. 9-18ca ggll GgLl Male Female Offspring Gray long Black vestigial Gray vestigial Black long 944 206 185 965 Parental phenotypes Recombinant phenotypes 391 recombinants 2,300 total offspring = 0.17 or 17% Recombination frequency =