Download
1 / 30
300 likes | 415 Vues
QoS Routing and Forwarding. 2006. Benefits of QoS Routing. Without QoS routing: must probe path & backtrack; non optimal path, control traffic and processing OH, latency With QoS routing: optimal route; “focused congestion” avoidance efficient Call Admission Control (at the source)

E N D
Benefits of QoS Routing • Without QoS routing: • must probe path & backtrack; non optimal path, control traffic and processing OH, latency • With QoS routing: • optimal route; “focused congestion” avoidance • efficient Call Admission Control (at the source) • efficient bandwidth allocation (per traffic class) • resource renegotiation easier
Multiple Constraints QoS Routing Given: - a (real time) connection request with specified QoS requirements (e.g., Bdw, Delay, Jitter, packet loss, path reliability, etc) Find: - a min cost (typically min hop) path which satisfies such constraints - if no feasible path found, reject the connection
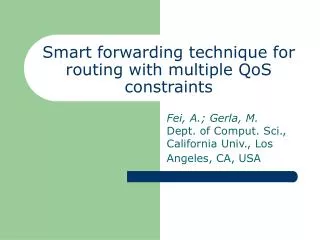
D = 25, BW = 55 D = 30, BW = 20 A B D = 5, BW = 90 D = 14, BW = 90 D = 5, BW = 90 D = 5, BW = 90 D = 2, BW = 90 D = 1, BW = 90 D = 5, BW = 90 D = 3, BW = 105 Example of QoS Routing2 Hop Path --> Fails (Total delay=55 > 25 and Min BW=20 < 30)3 Hop Path --> Succeeds (Total delay=24 < 25, Min BW=90 > 30)5 Hop Path --> Do not consider, although (Total Delay = 16 < 25, Min BW = 90 > 30) Constraints: Delay (D) <= 25, Available BW >= 30 We look for feasible path with least number of hops
The Components of QoS Routing • Q-OSPF: link state based protocol; it disseminates link state updates (including QoS parameters) to all nodes; it creates/maintains global topology map at each node • OSPF (Open Shortest Path First): for intra-AS routing • is a link-state protocol that uses flooding of link state information and a Dijkstra least cost path algorithm • To replace the Dijkstra algorithm using Bellman-Ford constrained path computation algorithm: it computes constrained min hop paths to all destinations at each node based on topology map • Call Acceptance Control (CAC) • Packet Forwarding: source route or MPLS
OSPF Overview 5 Message Types 1) “Hello” - lets a node know who the neighbors are 2) Link State Update - describes sender’s cost to its neighbors 3) Link State Ack. - acknowledges Link State Update 4) Database description - lets nodes determine who has the most recent link state information 5) Link State Request - requests link state information
1 A 2 C 1 E 2 3 B 3 D 2 OSPF Overview (cont) “Link State Update Flooding”
OSPF Overview (cont) “Hello” message is sent every 10 seconds and only between neighboring routers Link State Update is sent every 30 minutes or upon a change in a cost of a path Link State Update is the only OSPF message which is acknowledged Routers on the same LAN use “Designated Router” scheme
Implementation of OSPF in QoS Simulator Link State Update is sent every 2 seconds No ack is generated for Link State Updates Link State Update may include (for example): - Queue size of each outgoing queue (averaged over 10s sliding window) - Throughput on each outgoing link (averaged over 10s sliding window) - Total bandwidth (capacity of the link) Source router can use above information to calculate - end-to-end delay, - available buffer size, - available bandwidth
1 1 D D =1 =00 2 4 10 2 4 2 4 1 1 1 D =0 one hop h 1 D i 1 1 2 4 2 1 1 1 D D =3 =00 3 5 3 2 3 3 5 3 5 D 2 2 3 3 D D D D =1 =11 =1 =7 2 4 2 4 10 2 4 2 4 1 1 2 3 three hops D D =0 =0 two hops 1 1 h* h 2 1 1 1 1 2 2 3 3 D D D D =2 =5 =2 =4 3 5 3 5 3 2 2 3 3 5 3 5 Bellman-Ford Algorithm (with delay) h+1 h Bellman Equation : D =min[ d(i ,j) + ] D j i
B/F Algorithm Properties • MC (multiple constraints) Bellman Ford algorithm replaces the Dijkstra algorithm of conventional OSPF implementations • B/F slightly less efficient than Dijkstra ( O(NxN) instead of O (NlgN) ) • However, B/F generates solutions by increasing hop distance; thus, the first found feasible solution is “hop” optimal (ie, min hop) • Polynomial performance for most common sets of MC (multiple constraints e.g. bandwidth and delay )
CAC and Packet Forwarding • CAC: if feasible path not found, call is rejected; alternatively, source is notified of constraint violation, and can resubmit with relaxed constraint (call renegotiation) • Packet forwarding: (a) source routing (per flow) (b) MPLS (per class)
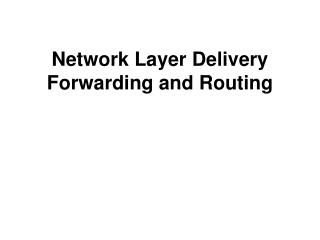
Application I: IP Telephony • M-CAC at source; no bandwidth reservation along path • 36 node, highly connected network • Trunk capacity = 15Mbps • Non uniform traffic requirement • Two routing strategies are compared: • Minhop routing (no CAC) • QoS routing • Simulation platform (UCLA) : PARSEC wired network simulation (QualNet)
0 1 2 3 4 5 7 8 9 6 10 11 13 14 15 16 17 12 18 21 22 23 19 20 25 24 26 27 28 29 35 31 32 33 34 30 50 Km 15 Mbit/sec
TALK SILENCE 1/ = 352 ms 1/ = 650 ms QoS Simulator: Voice Source Modeling • Voice connection requests arrive according to a Poisson process, or at fixed intervals • Once a connection is established, the voice source is modeled as 2 state Markov chain • 1 voice packet every 20ms during talk state
Simulation Parameters • 10 Minute Simulation Runs • Each voice connection lasts 3 minutes • OSPF updates are generated every 2 seconds (30 minute OSPF update interval in Minhop scheme) • New voice connections generated with fixed interarrival (150 ms) • Measurements are in Steady-state (after 3 minutes) • 100 msec delay threshold • 3 Mbit/sec bandwidth margin on each trunk • The candidate source destination pairs are : (8,20),(0,34),(3,32), (4,32), (5,32), (10,32), (16, 32)
Minhop Routing • We note that the rate from the 5 sources (3, 4, 5, 10, 16) into destination 32 is 4.76 calls/sec, exceeding the processing capacity of a single path which is 3.2 in Min Hop and 2.6 in MC BF
Minhop Routing (cont.) • The source-destination pairs (0,34) and (8,20) are getting all of their calls through with zero loss and end-to-end delays below 100ms threshold. This is because they enjoy exclusive use of minhop paths (0,1,18,19,25,24,34) and (8,14,20), respectively • The remaining source destination pairs (3,32), (4,32), (5,32), (10,32), and (16,32) do not even get a single packet through with delay below 100msec threshold. Moreover, they suffer heavy loss. The reason is very simple: they all share a common subpath (9, 8, 2, 32) and thus compete for the same bottleneck
0 1 2 3 4 5 7 8 9 6 10 11 13 14 15 16 17 12 50 Km 18 21 22 23 19 20 15 Mbit/sec 25 24 26 27 28 29 35 31 32 33 34 30 MINHOP ROUTING
QoS Routing • MC Bellman-Ford routing algorithm manages to balance the load on alternate paths • In fact, two alternate paths are used to route the traffic originating from the 5 sources
0 1 2 3 4 5 7 8 9 6 10 11 13 14 15 16 17 12 50 Km 18 21 22 23 19 20 15 Mbit/sec 25 24 26 27 28 29 35 31 32 33 34 30 QoS ROUTING
0 1 2 3 4 5 7 8 9 6 10 11 13 14 15 16 17 12 50 Km 18 21 22 23 19 20 15 Mbit/sec 25 24 26 27 28 29 35 31 32 33 34 30 QoS ROUTING
QoS Routing Minhop Minhop w/ CAC # voice calls attempted in steady state 2762 2762 2790 # voice calls accepted in steady state 2762 2762 1875 % of packets lost 0.0 % 11.78 % 0.0 % % of packets above 100 ms 0.0 % 51.34 % 0.0 % 100.0 % 36.88 % % of packets below 100 ms 100.0 % Preliminary Analysis • The QoS routing accepts all the offered calls by spreading the load on alternate paths
OSPF packet size was 350 bytes • OSPF (LSA) updates were generated every 2 seconds • Measurements were performed on a “perfect square grid” topology
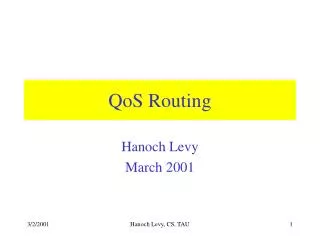
Application II: MPEG Video • Res. All. CAC • RSVP type signaling required • Effective bandwidth & buffer reservations • 36 node grid-type topology • Trunk capacity = 5.5 Mbps • Inputs = Measured MPEG traces • QoS guarantees: no-loss; delay < Tmax • Simulation platform: PARSEC wired network simulation (QualNet)
APPLICATION ORDER SOURCE NODE DESTINATION NODE PATH CAC Y/N REJECTION NODE 1 0 35 1 18 19 20 21 22 28 29 35 Y 2 24 13 25 19 20 14 13 Y 3 19 20 25 31 32 26 20 Y 4 1 18 18 Y 5 34 35 28 29 35 Y 6 18 21 19 20 21 N 19 1 7 8 14 20 21 Y 7 29 35 NO PATH FOUND 8 9 18 8 7 1 18 N 1 8 14 20 19 18 Y 9 27 21 26 20 21 N 20 26 20 14 8 9 15 21 Y 10 22 28 28 Y 11 22 28 21 20 19 25 24 34 28 Y SIMULATION RESULTS Bandwidth/link: 5.5 Mbps unidirectional Tmax: 0.1 s Effective bandwidth: 2.6 Mbps Effective buffer: 260 KB (no buffer saturation)
0 1 2 3 4 5 1 6 9 7 8 9 6 10 11 8 4 13 14 15 16 17 12 18 21 22 23 19 20 8 6 10 2 9 25 24 26 27 28 29 5 7 3 35 31 32 33 34 30 11
Video Only Result Comparisons Class based QoS routing with reservation vs. Measurement based QoS routing without reservation Bandwidth/link: 5.5 Mbps unidirectional Tmax: 0.1 s, Duration 10 min
Conclusions • QoS routing beneficial for CAC, enhanced routing, resource allocation and resource renegotiation • Can efficiently handle flow aggregation (Diffserv) • Q-OSPF overhead manageable up to > 100 nodes • Can be scaled to thousands of nodes using hierarchical OSPF • Major improvements observed in handling of IP telephony and MPEG video • MPEG video best served via reservations • Future Work:Extension to hierarchical OSPF, to interdomain routing, to multiple classes of traffic and statistical allocation of MPEG sources