Download

1 / 25
260 likes | 351 Vues
A brief history of Iran’s main economical Statics with some comparision with other countries. محصول ناخالص داخلي به تفكيك اجزاي هزينه نهايي به قيمتهاي جاري در دوره 1345- 1385. Y= C + G + I + NX. 100=76. محصول ناخالص داخلي به تفكيك اجزاي هزينه نهايي به قيمتهاي ثابت در دوره 1345- 1385.

E N D
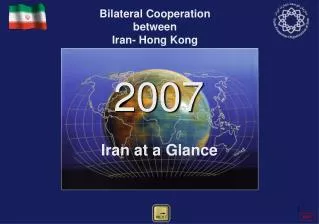
A brief history of Iran’s main economical Statics with some comparision with other countries
محصول ناخالص داخلي به تفكيك اجزاي هزينه نهايي به قيمتهاي جاري در دوره 1345- 1385 Y= C + G + I + NX
100=76 محصول ناخالص داخلي به تفكيك اجزاي هزينه نهايي به قيمتهاي ثابت در دوره 1345- 1385
تغییرات محصول ناخالص داخلي به قيمتهاي ثابت (بر طبق آمار مرکز آمار)
تغییرات محصول ناخالص داخلي به قيمتهاي ثابت (بر طبق آمار بانک جهانی)
Life expectancy امید به زندگی … is the average lifespan a newborn can expect … is short when child deaths are common
Let’s compare Sweden Burundi
100 Burundi Life expectancy(years) 80 60 Burundi 50 years 40 Population (millions) 1 100 20 1000 Can you get old in Burundi? 0 200 $ 2000 $ 20 000 $ Income per person (comparable dollars per year)
100 Burundi Burundi 2007 2007 Life expectancy(years) 80 Age (years) 60 Burundi 50 years 40 Population (millions) 1 100 20 1000 0 200 $ 2000 $ 20 000 $ Income per person (comparable dollars per year)
100 Burundi Calculate the mean… 84 2007 This is the Life Expectancy 80 72 = 50 57 Age (years) 60 50 years 36 40 20 1+36+57+72+84 5 1 0 Pierre Liz Jean Ann Sarah
Sweden 100 Sweden Life expectancy(years) 81 years 80 60 40 Population (millions) 1 100 20 1000 Do all Swedes live 31 years longer than the Burundians? 0 200 $ 2000 $ 20 000 $ Income per person (comparable dollars per year)
93 100 88 Sweden 84 2007 77 81 years 80 63 Age (years) 60 40 Calculate the mean… 20 =81 63+77+84+88+93 5 0 Per Lisa Jan Anton Sara
100 “To live long” in Sweden is almost the same as “to live long” in Burundi 2007 80 Age (years) 60 40 20 But “dying young” in Sweden is very different from “dying young” in Burundi So, no, all Burundians donot live 31 years shorterthan Swedes 0
منابع: مرکز آمار ایران: http://amar.org.ir/ بانک جهانی: data.worldbank.org ویکی پدیا: en.wikipedia.org Gapminder.org TED.com